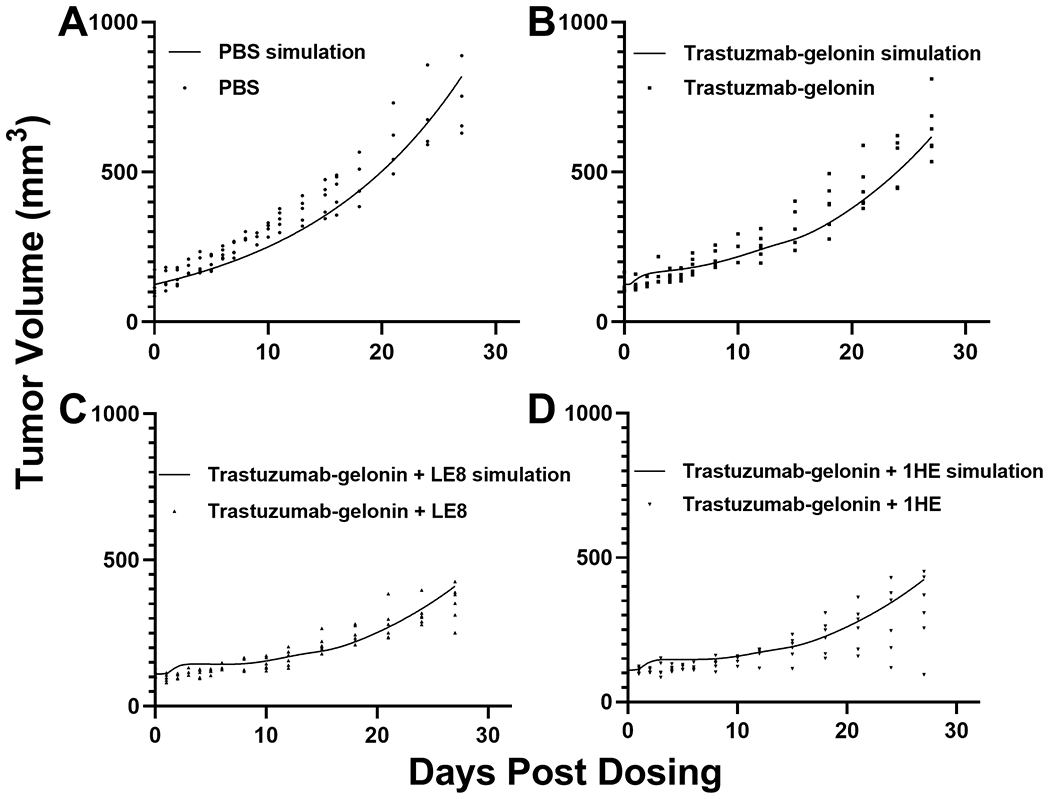
Figure 6: The PK/PD model accurately predicts the tumor response to trastuzumab gelonin treatment:

Simulated tumor profiles following treatment with (A) PBS, (B) 2.5 mg/kg trastuzumab-gelonin, (C) 2.5 mg/kg trastuzumab-gelonin+LE8, and (D) 2.5 mg/kg trastuzumab-gelonin+1HE are shown as solid lines. Solid symbols represent observed NCI-N87 tumor volumes for individual xenografts at different timepoints.
