
Figure 3. PIDDosome components control fructose induced lipid metabolizing genes.
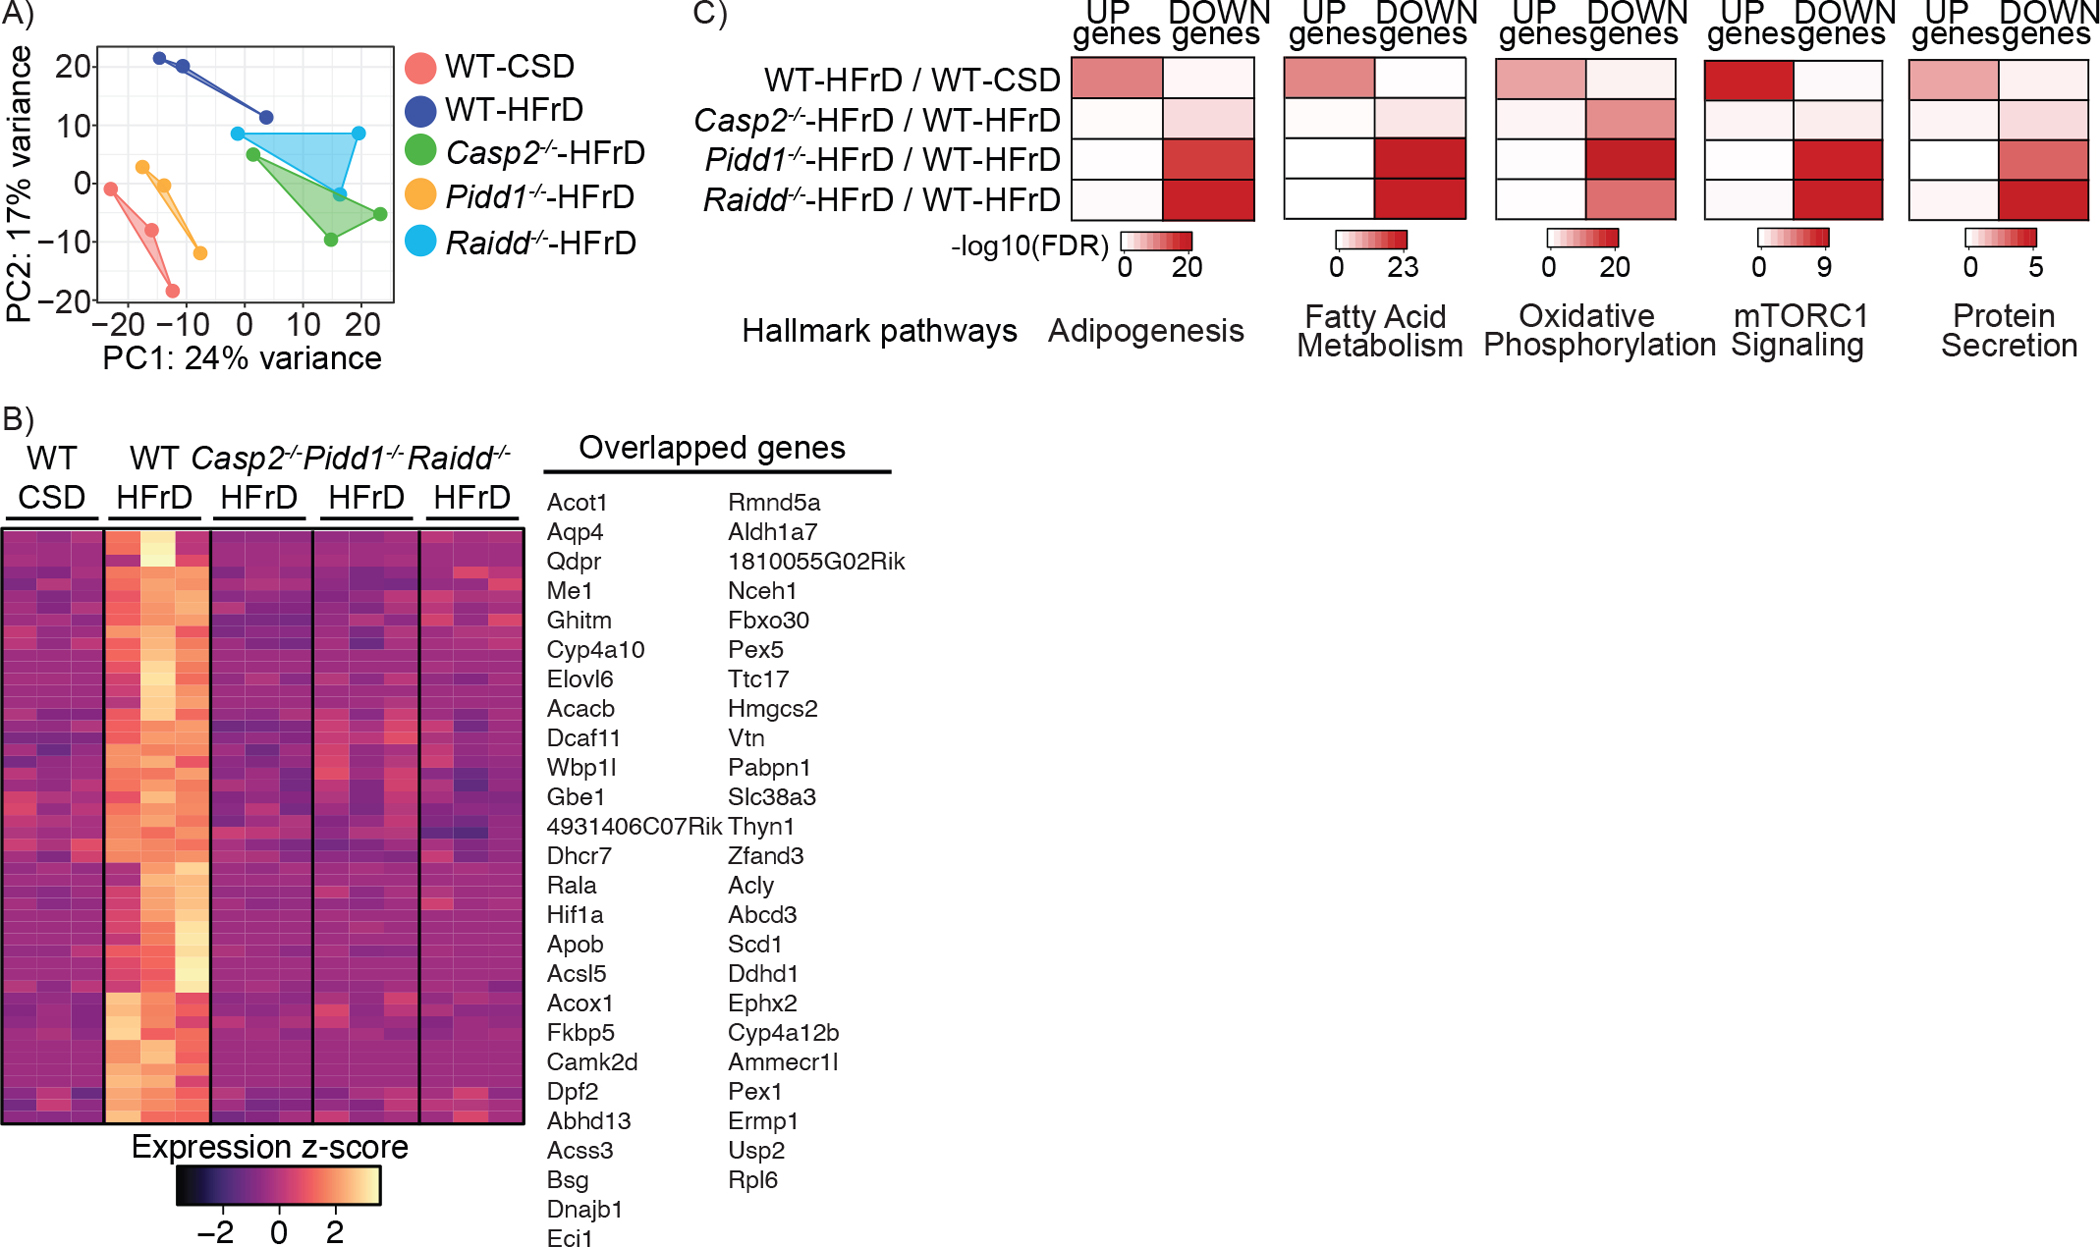
WT, Casp2−/−, Pidd1−/−, and Raidd−/− mice were fed CSD or HFrD for 12 weeks. Total liver RNA was extracted and subjected to whole genome RNA-seq analysis.
A. Principal Component Analysis (PCA) plot showing 5 groups with 3 biological replicates each. The PCA captured the variation of the samples among 5 groups, showing PC1 and PC2 scores. Each group is shown with geom_polygon function of ggplot2.
B. Venn diagram showing overlapping genes from 4 comparative analyses. Selected overlapping genes are listed on the right.
C. Heatmap showing significantly altered genes among the 5 groups. Overlapping pathways among 4 comparisons (n=50) were visualized in z-score scale.