
Figure 6. Scap ablation potentiates fructose-induced ER stress and PIDDosome activation.
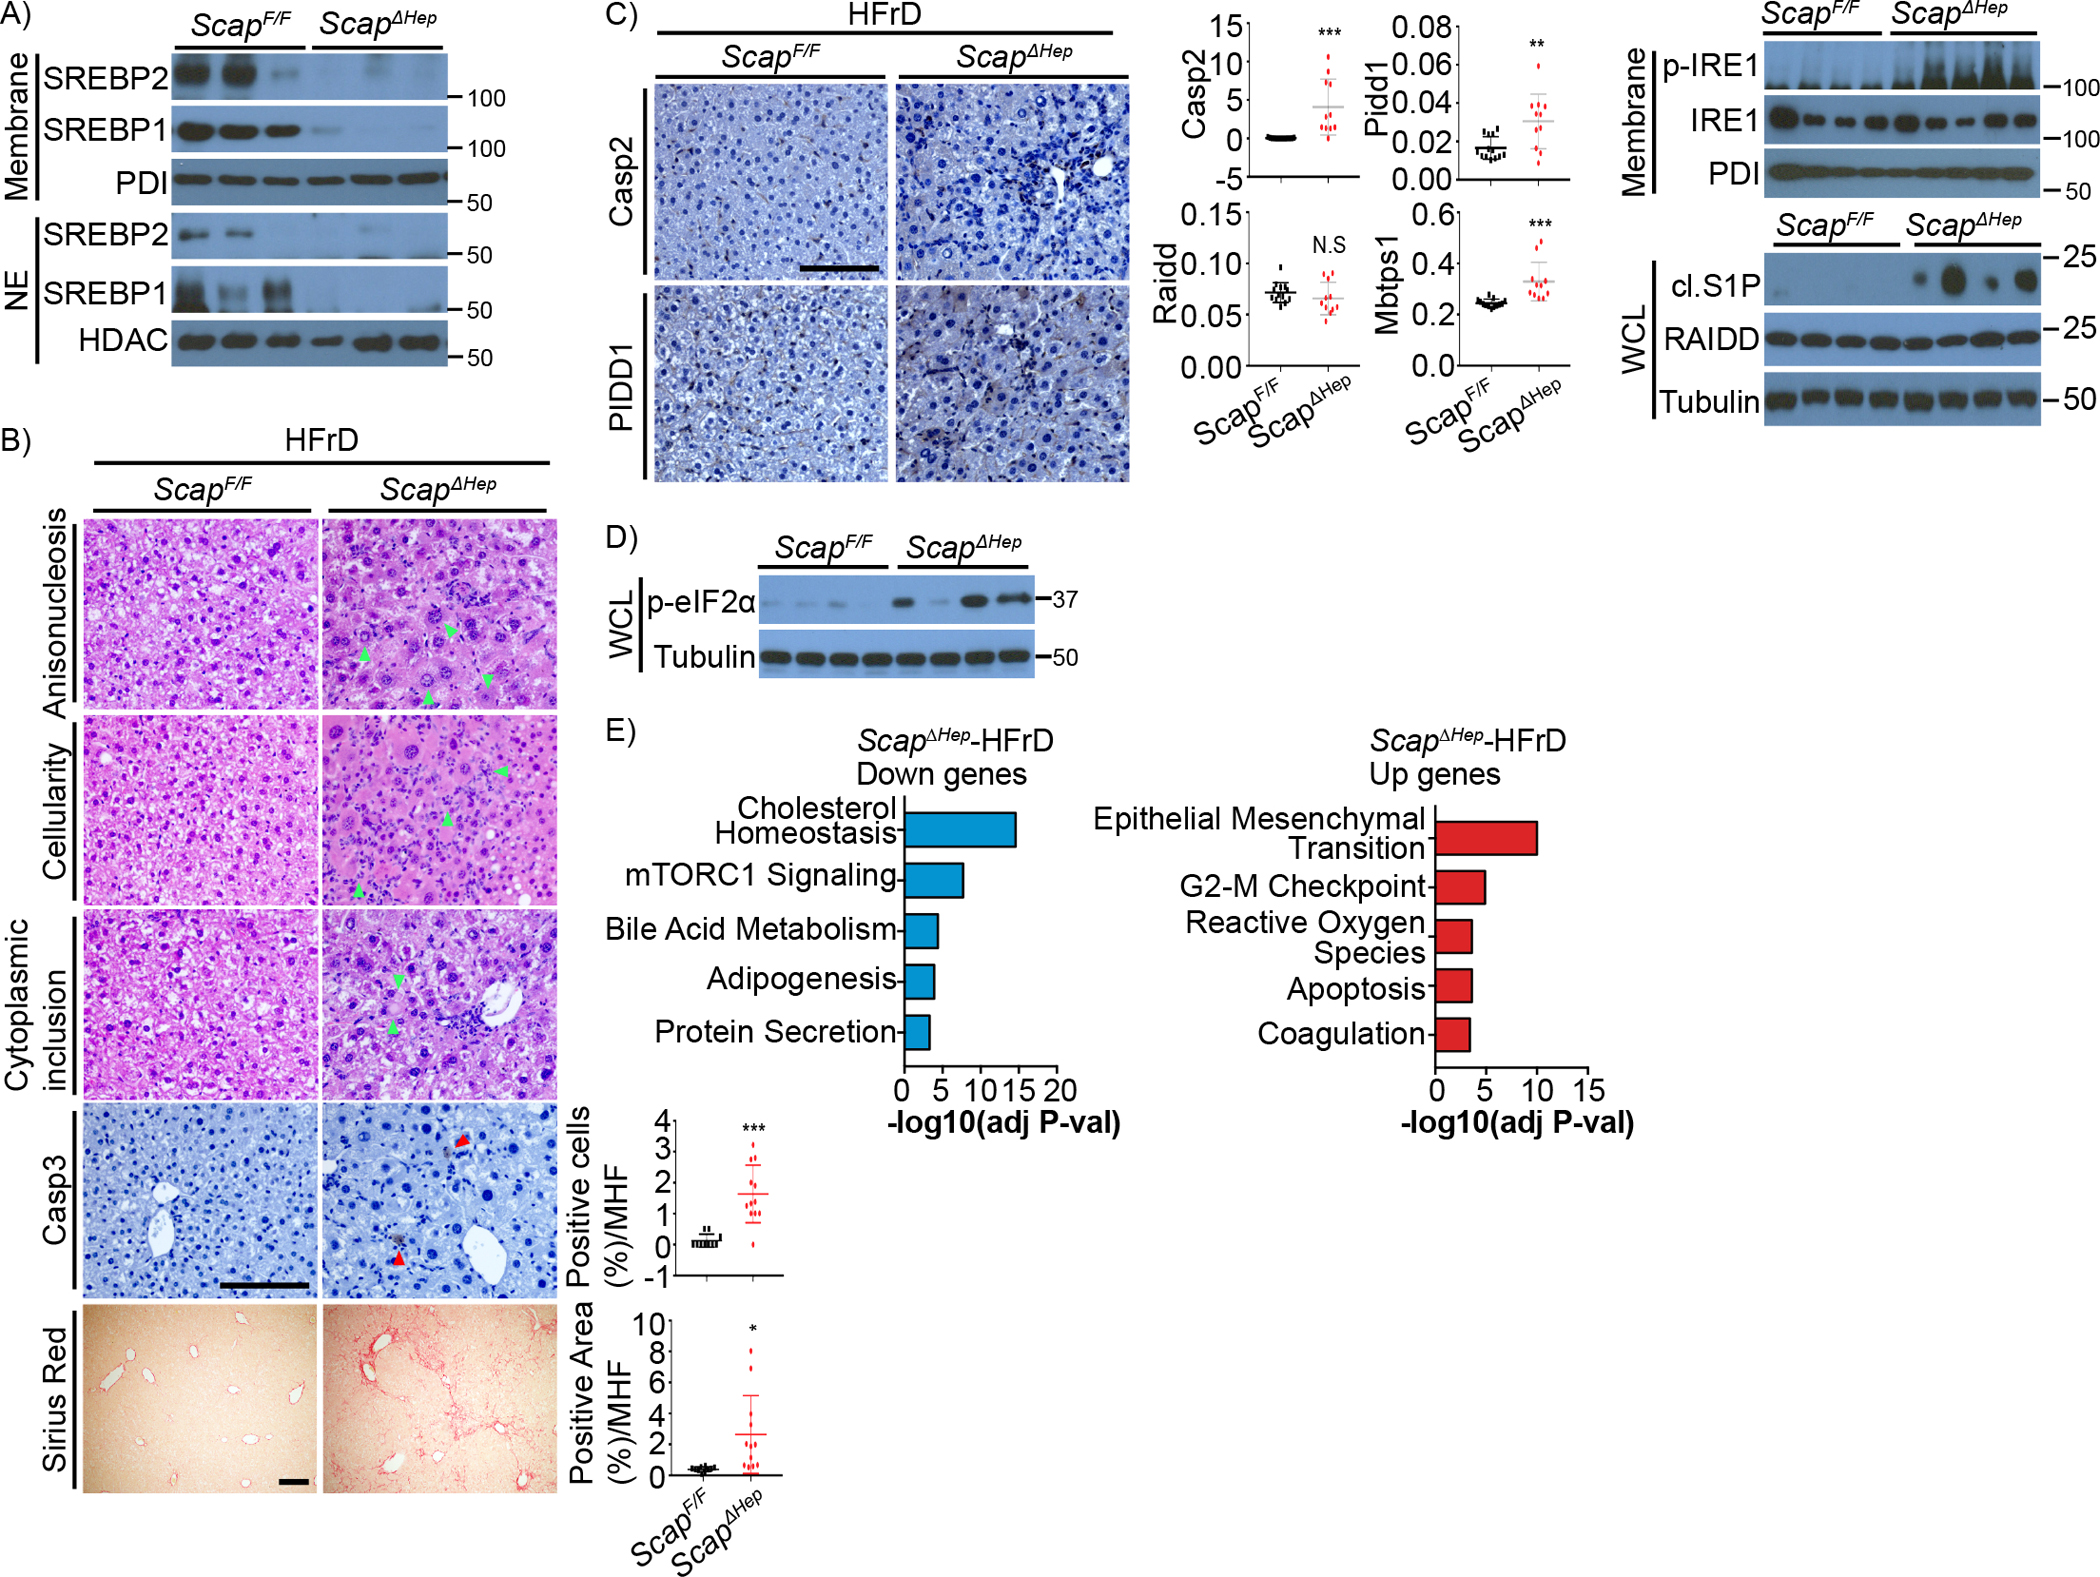
ScapF/F (n=13) and ScapΔhep (n=11) mice were fed HFrD for 12 weeks.
A. IB analysis of precursor and cleaved SREBP1/2 in above livers.
B. Liver sections from above mice were stained with H&E, Sirius red, and cleaved Casp3 antibody. Anisonucleosis, portal cellularity, cytoplasmic inclusion, indicated by light green arrowheads, and Casp3-positive hepatocytes, indicated by red arrowheads, and fibrosis were visualized in above livers. Quantification is shown on the right.
C. IHC analysis of Casp2 and PIDD1 in livers of above mice and relative mRNA expression of PIDDosome components and S1P (MBTPS1) are shown on the right. IB analysis of phospho-IRE1 and cleaved (cl.) S1P is at the bottom.
D. eIF2α phosphorylation in livers of above mice.
E. Hallmark pathways from Enrich analysis using up- or down-regulated genes in HFrD-ScapΔhep compared to HFrD-ScapF/F livers with 3 biological replicates each.
Results are mean ± SEM. Scale bar, 100 μm. Statistical significance was performed by two-tailed Student’s t test. *p < 0.05, **p < 0.005, ***p < 0.001.