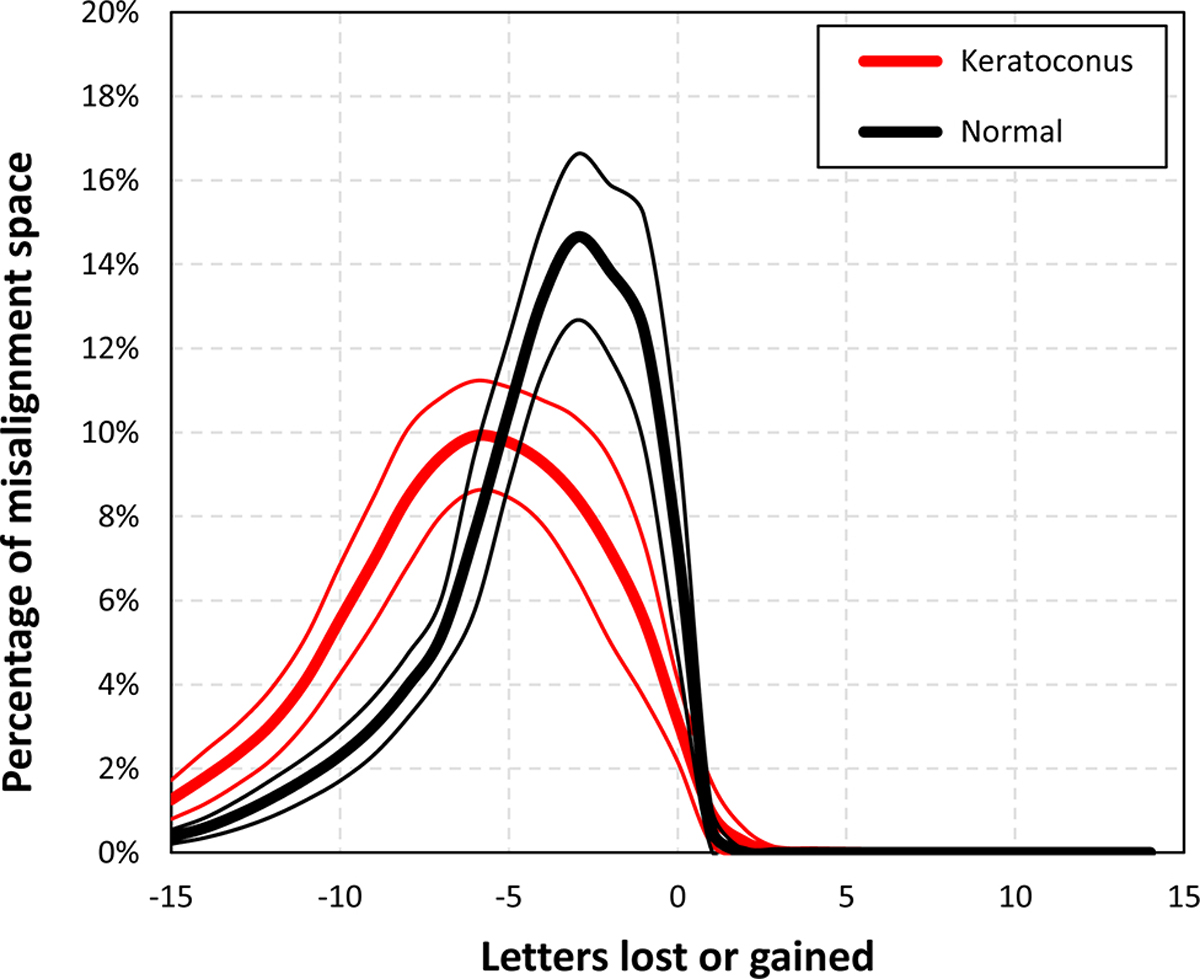
Figure 4:

Histograms showing the volumes between the iso-surfaces of letters gained or lost, where a broad distribution indicates a low tolerance to misalignment and a narrow distribution indicates a high tolerance.

Histograms showing the volumes between the iso-surfaces of letters gained or lost, where a broad distribution indicates a low tolerance to misalignment and a narrow distribution indicates a high tolerance.