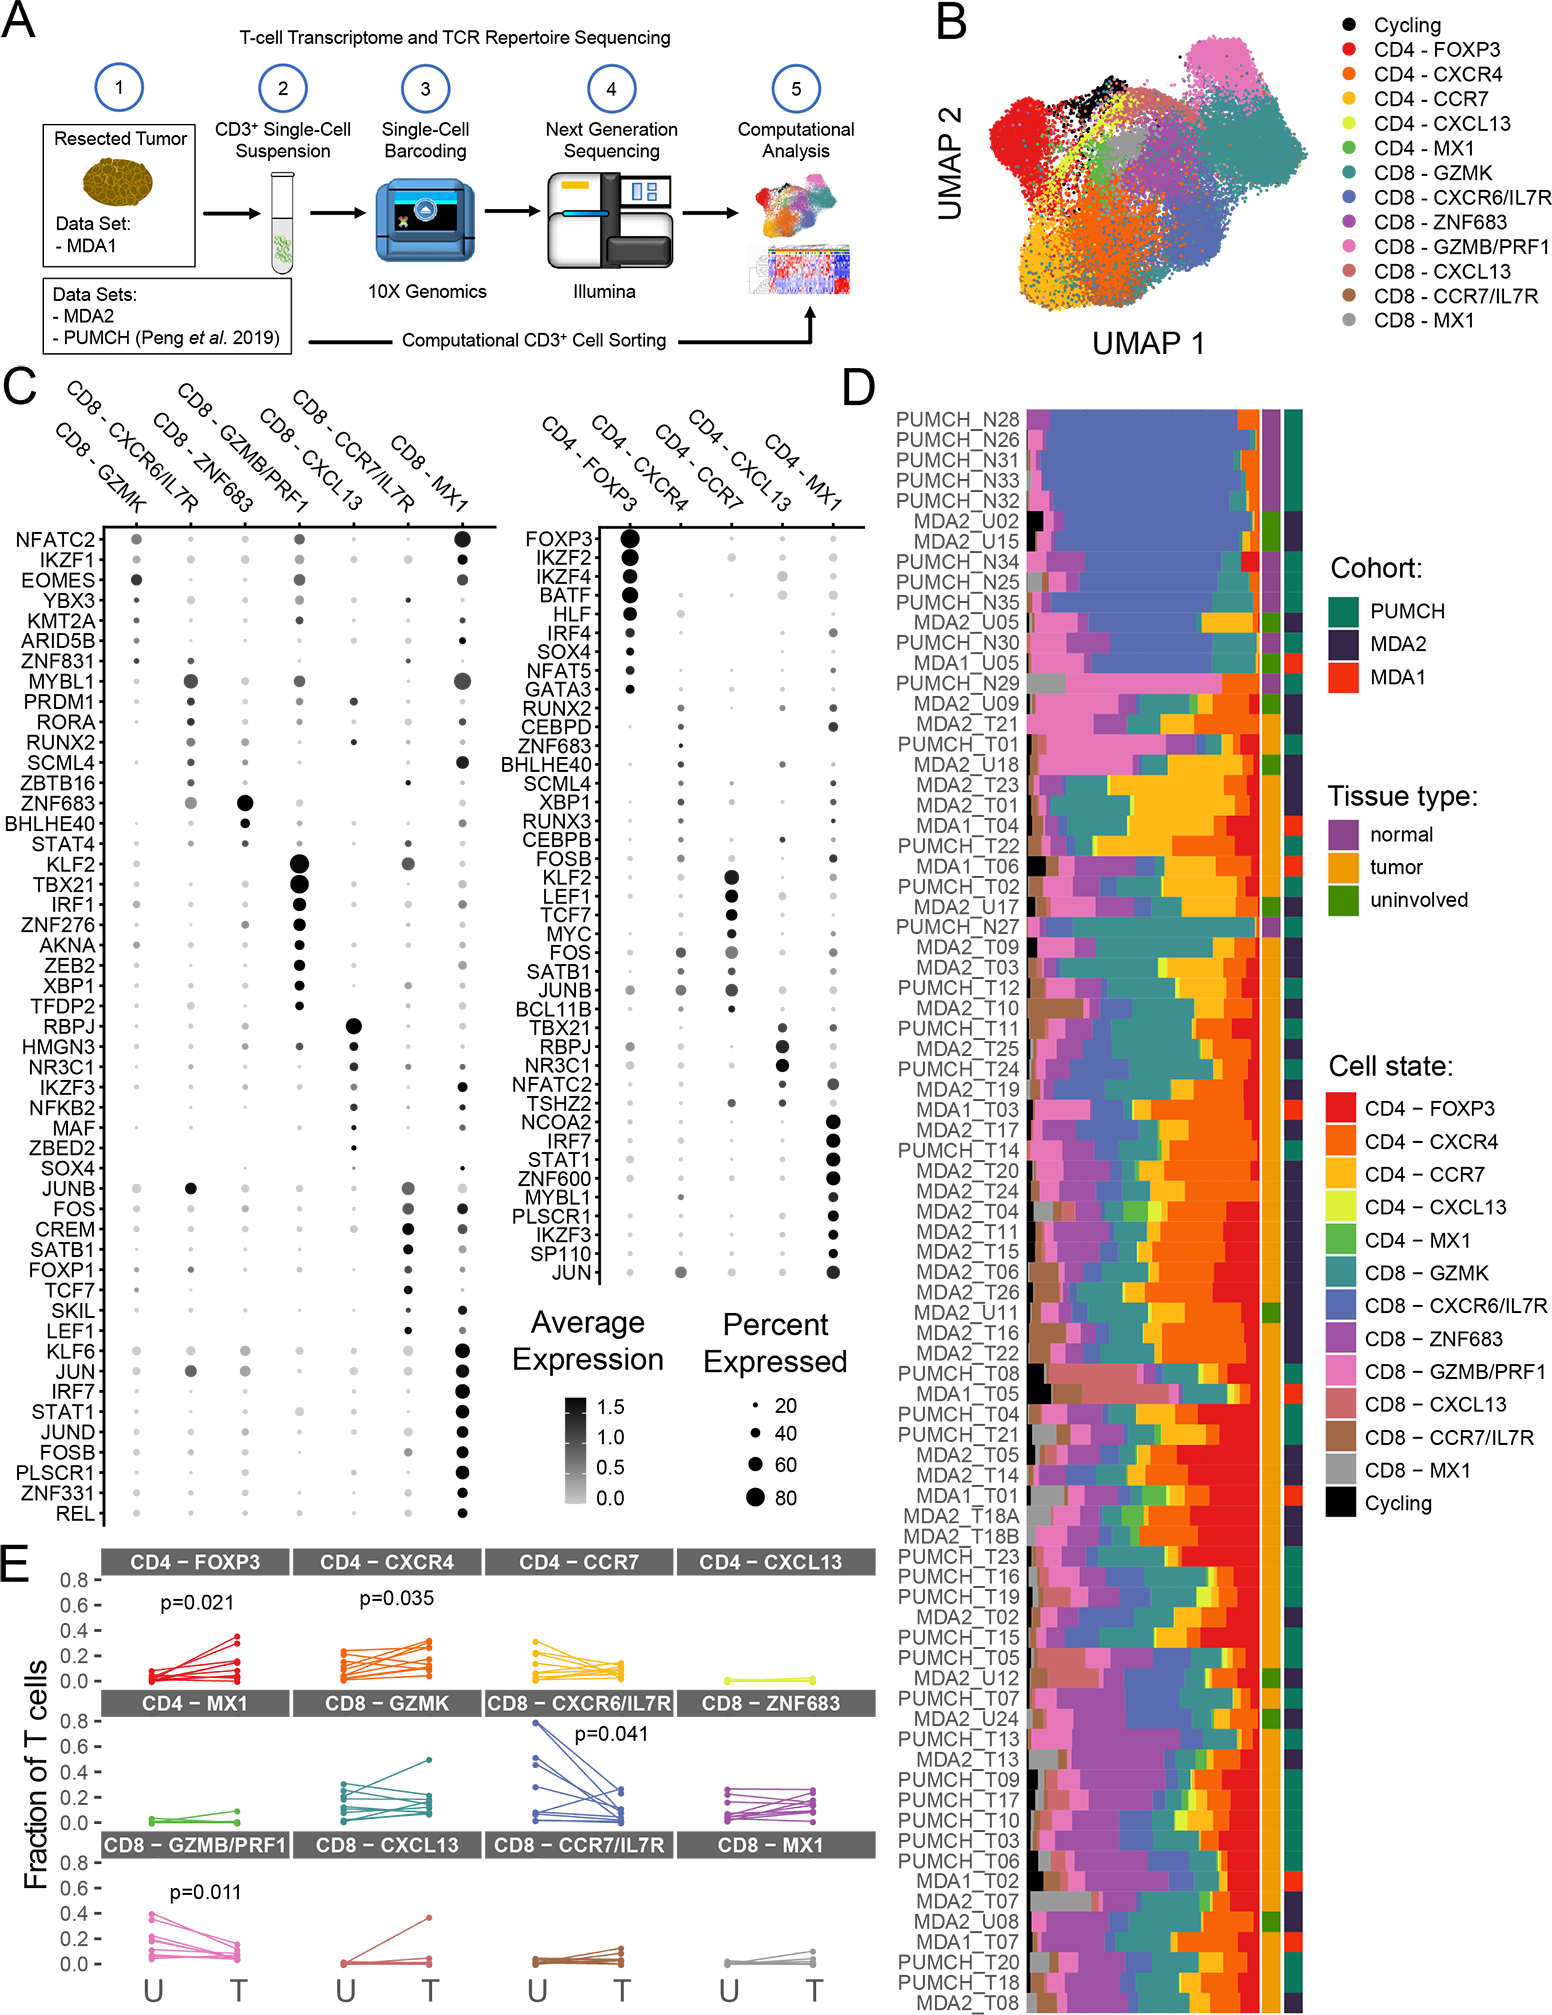
Figure 1. Clustering and differential gene expression analysis of pancreatic ductal adenocarcinoma (PDAC) tumor-infiltrating lymphocytes (TIL).

(A) Scheme of overall study in which TIL from three cohorts (two internal and one previously published) from PDAC and uninvolved/normal tissue underwent single-cell RNA sequencing analysis, and the data generated were used for transcriptomic and TCR sequencing analyses. (B) The uniform manifold approximation and projection (UMAP) projection of 39,694 single T cells from 57 PDAC samples and 22 uninvolved samples, showing seven CD8+ and five CD4+ cell state populations identified by shared nearest neighbor clustering. Each dot is a single cell and is colored according to transcriptomic state. (C) Top differentially expressed transcription factors for CD8+ and CD4+ TIL. Expression is marked by appearance of a circle, where greater the size indicates a greater percentage of cells express this gene and a color gradient that indicates higher level of expression as it moves from light gray to black. (D) A breakdown of the cell states within each patient sample is shown, where the samples are ordered by hierarchical tree. The fraction of T cells within each transcriptomic cell state is indicated by the size of the colored segments of each horizontal bar. Each horizontal bar represents an individual patient sample. Starting from the right side of the graph to the left side, the cohort, the tissue type, and cell state for each sample are indicated by colored squares. (E) Comparison of T-cell state frequencies between matched tumor and uninvolved samples (n=10). Only P values < 0.05 are displayed and were generated using a paired Wilcoxon statistical test, but no significant correlation was maintained after P value correction for multiple-testing.
