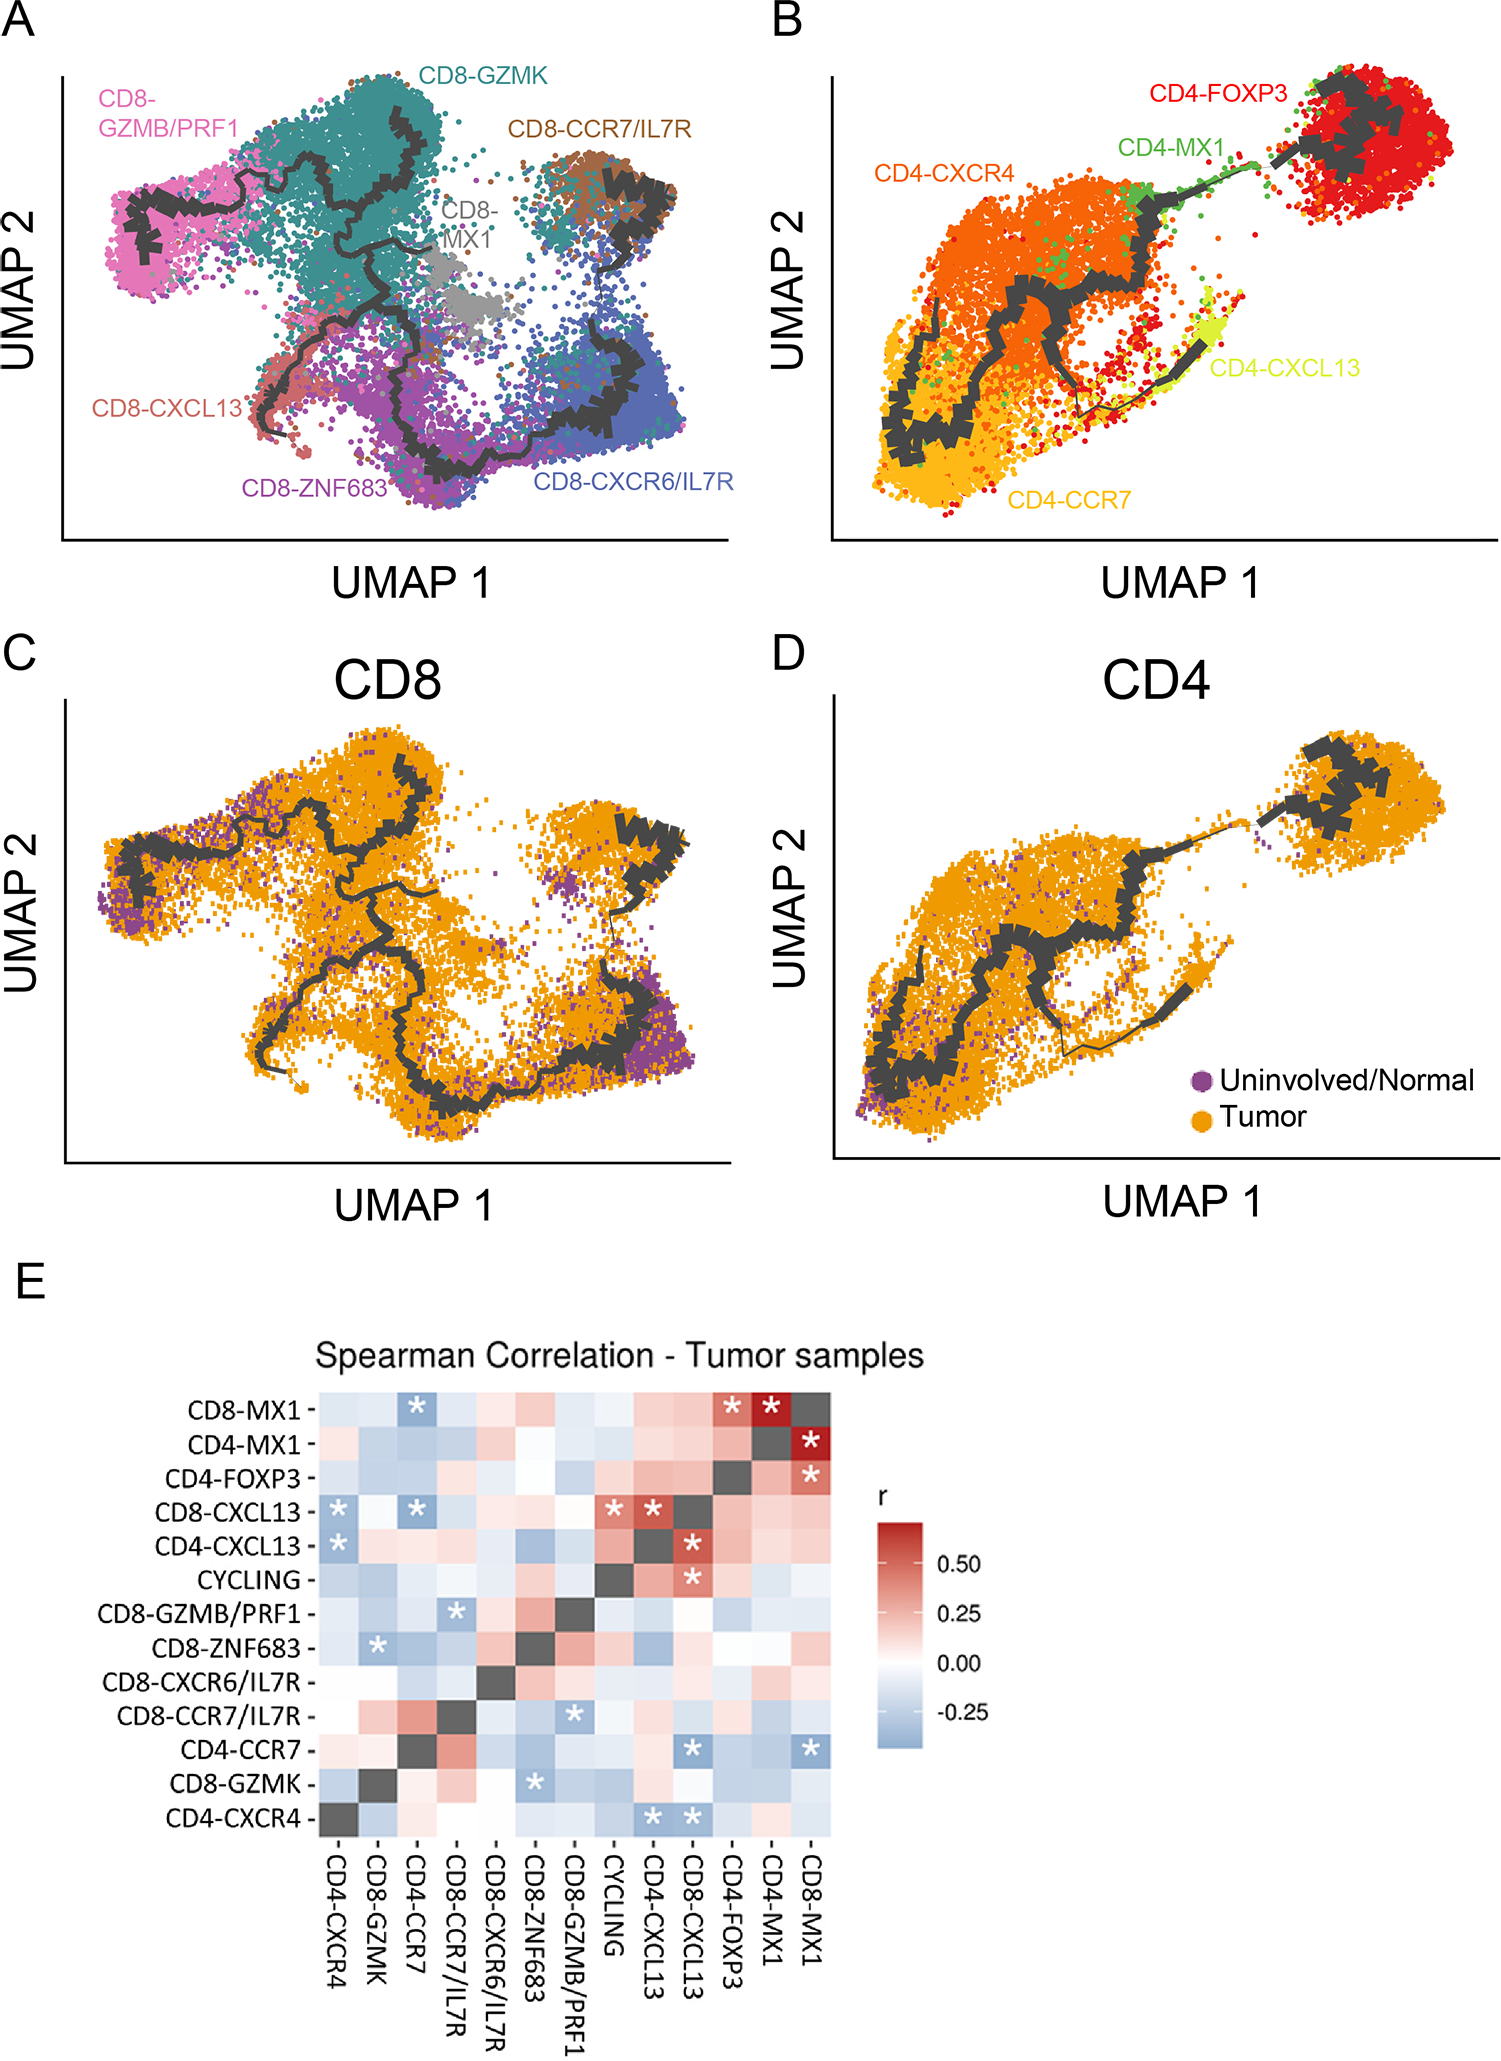
Figure 2. Relationship between pancreatic ductal adenocarcinoma (PDAC) tumor-infiltrating lymphocyte (TIL) cell states inferred from pseudotime analysis and correlation of co-occurrence.

Monocle 3 pseudotime trajectory inference analysis for (A) CD8+ TIL and (B) CD4+ TIL. The thickness of the connecting lines is weighted based on the density of cells at that node, which is proportional to the amount of support for the trajectory. Each dot is a single cell and cell states are colored by transcriptional cell state. The same pseudotime plots are presented for (C) CD8+ TIL and (D) CD4+ TIL, again with the connecting lines weighted by cell density, but now colored by whether that cell came from a tumor sample or uninvolved/normal sample. (E) The degree and significance to which cell states co-occur with each other was computed using Spearman correlation. The matrix pits each cell state against every other transcriptomic state. Red squares indicate positive correlation, blue squares indicate negative correlation, and asterisks denote statistical significance (P < 0.05).
