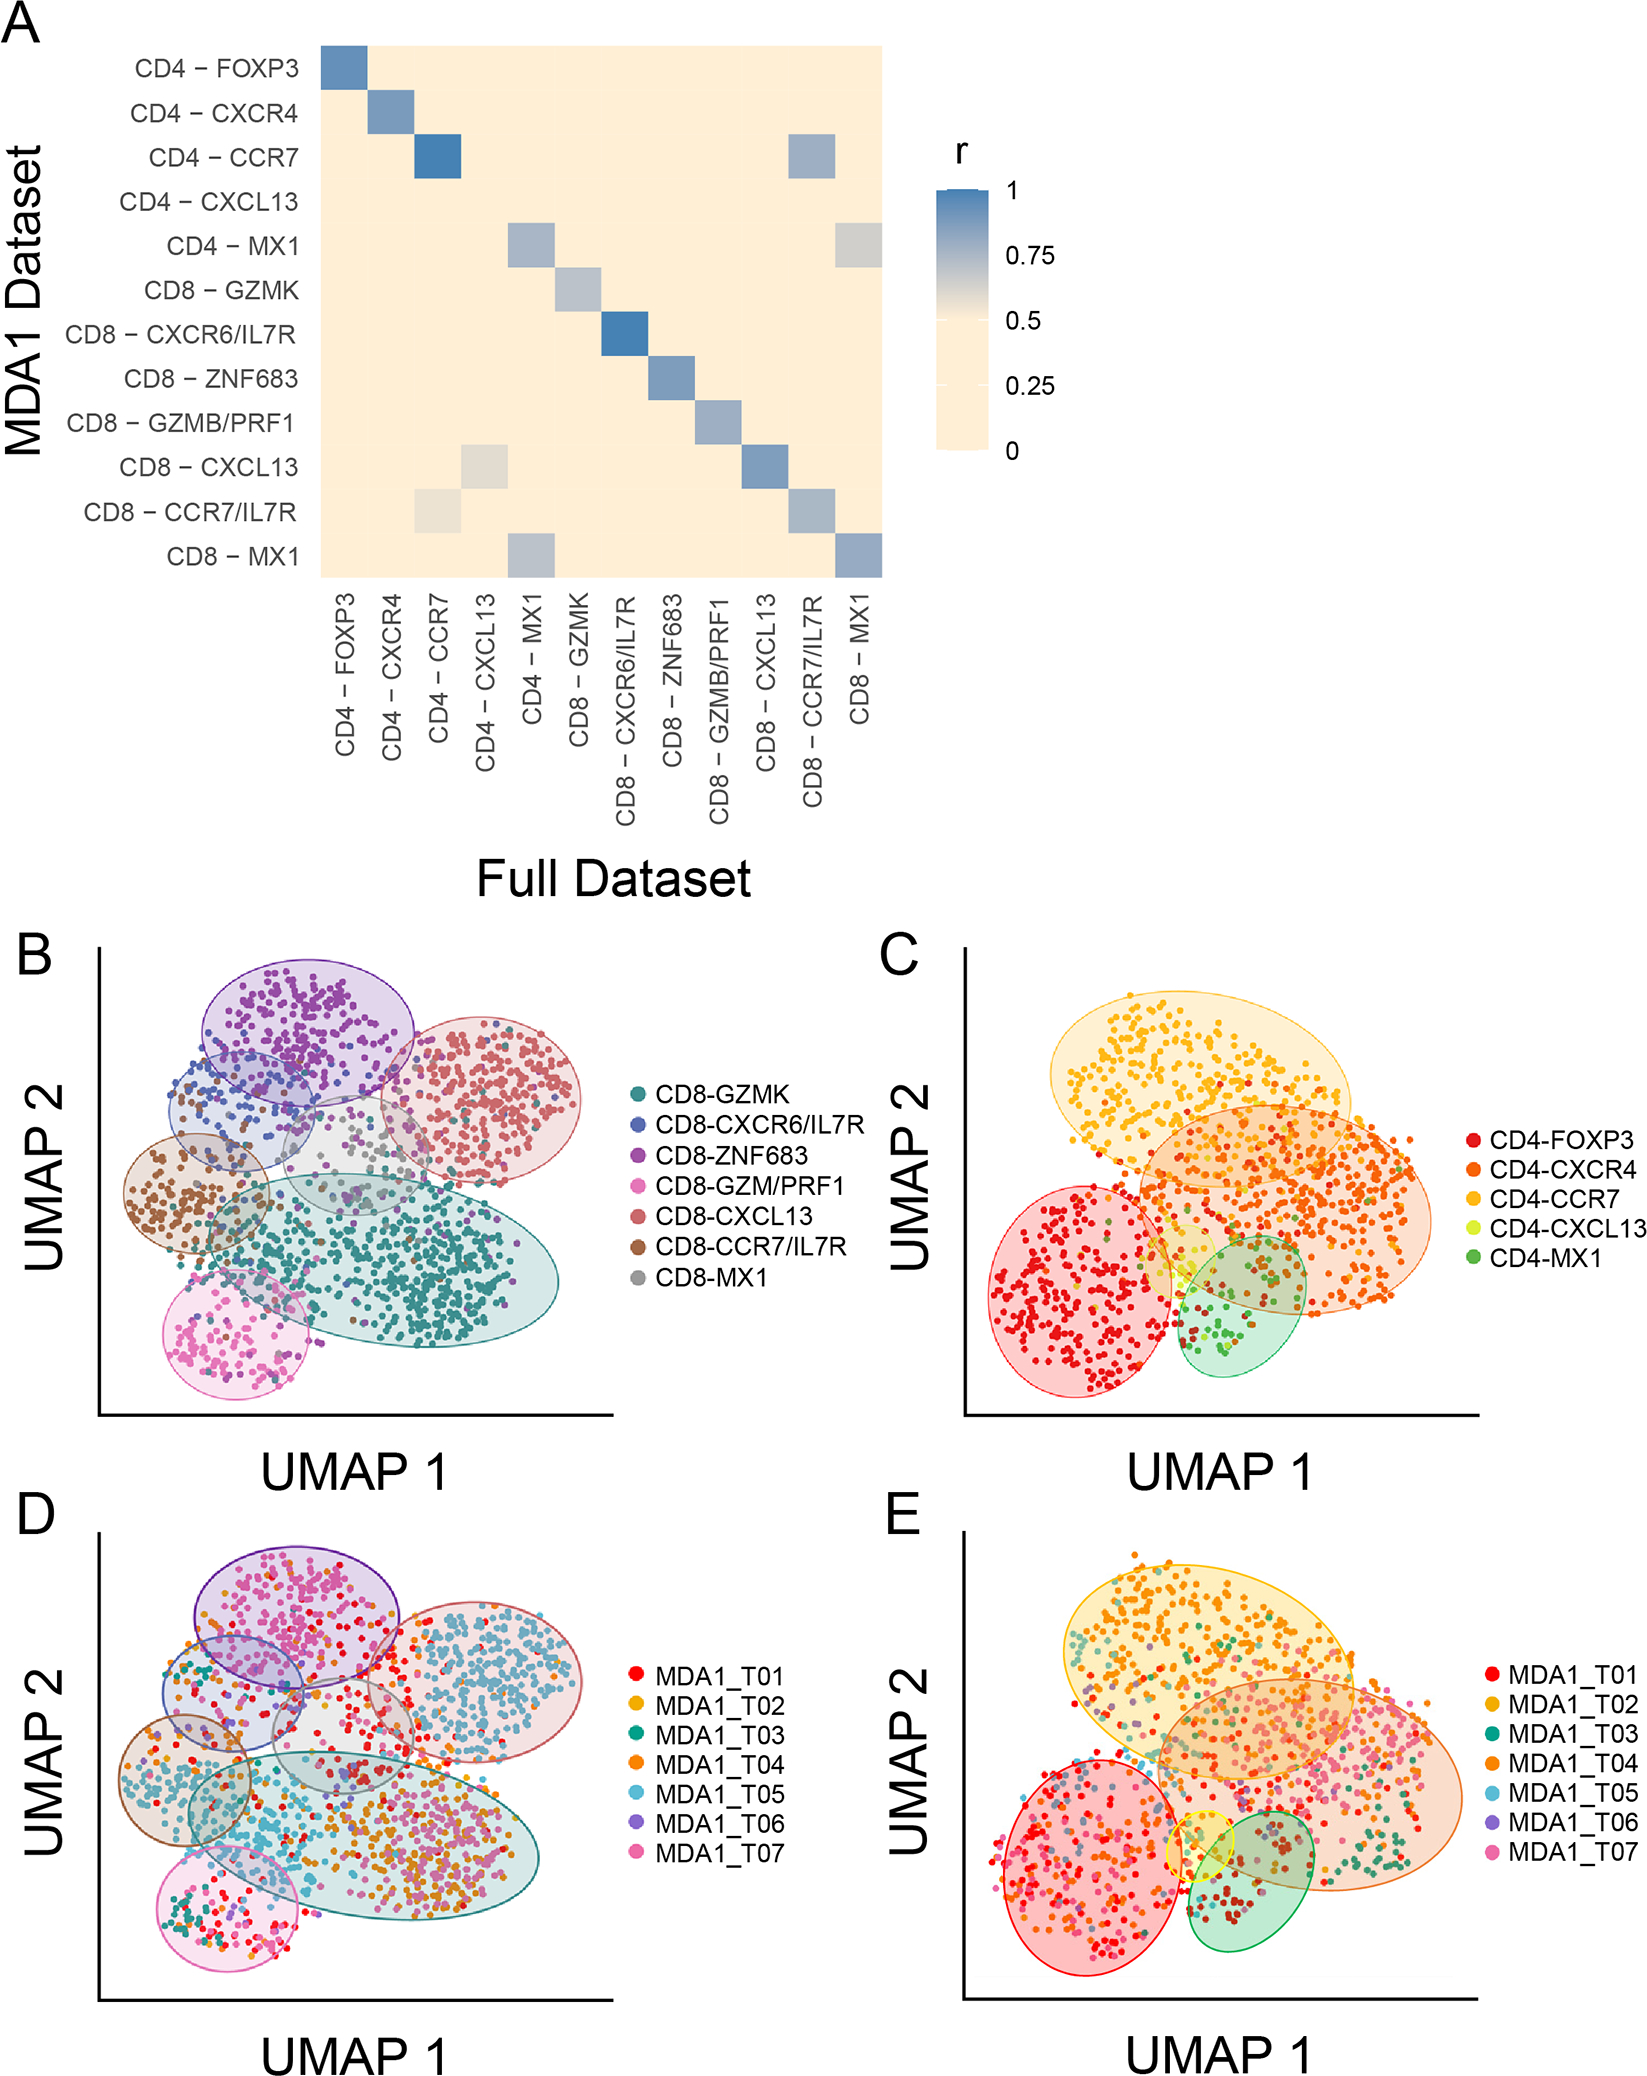
Figure 3. Features of multi-cohort data set are retained within subset of samples used to model the original data set.

(A) The degree to which the top genes in the tumor-infiltrating lymphocyte (TIL) cell states in the full data set (MDA1, MDA2, and PUMCH) overlap with the those in the MDA1 data set are visualized in a gene overlap matrix. Blue indicates a high degree of overlap, and beige indicates a low degree. Each cell-state has at least 70% of the top (P ≤ 0.05 and fold change ≥ 0.2) genes overlapping, except for CD4-CXCL13, which was hardly detected in the MDA1 data set. (B-E) The seven-sample MDA1 data set is represented using uniform manifold approximation and projection (UMAP) plots. The (B) CD8+ TIL and (C) CD4+ TIL states are labeled and colored using the same scheme as the larger data set, showing that co-localization of the original cell states is maintained. Colored ovals are used to indicate the position of each cell state. (D) and (E) represent the same UMAP plot for CD8 and CD4, respectively, but now colored by patient sample. The same colored ovals from (B) and (C) are used to indicate in which cell states each patient falls.
