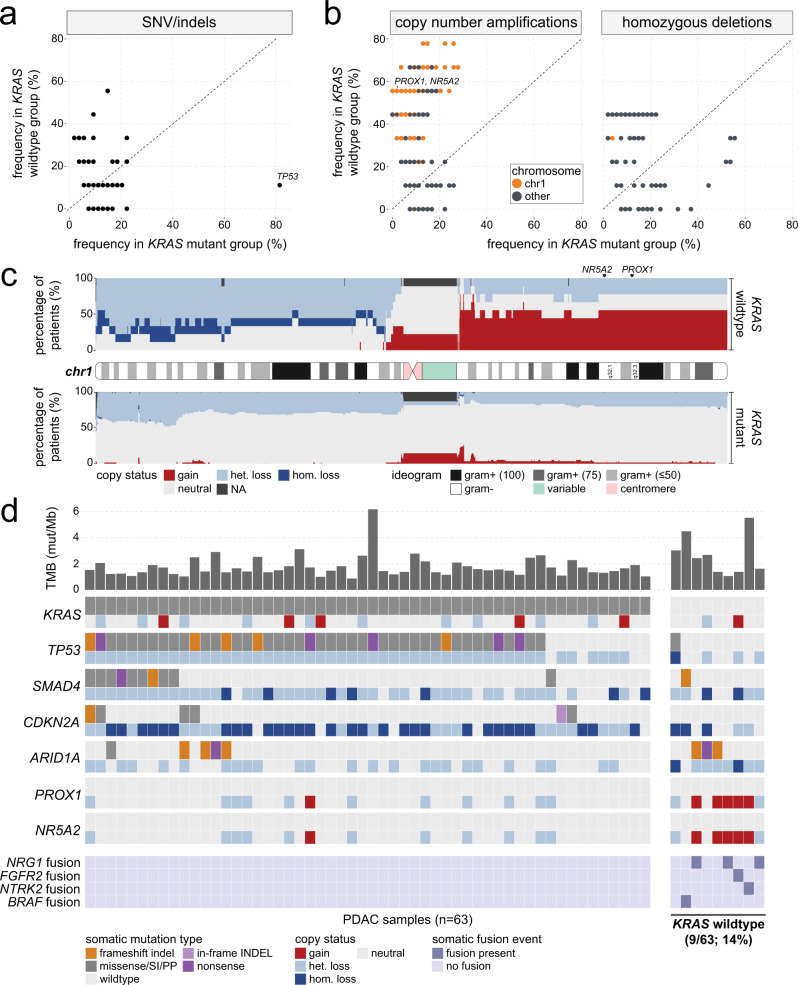
Fig. 2. Patients with KRAS wildtype mPDAC harbor distinct fusion events that enable targeted therapeutic approaches.
a Scatter plot comparing SNV/indel frequency across genes in KRAS wildtype versus mutant groups. b Scatter plot comparing copy number amplification (left) and deletion (right) events across genes in KRAS wildtype versus mutant groups. Colors indicate whether the gene is located on chromosome 1 (chr1). c Stacked bar plot showing CNV frequency across the length of chr1 in KRAS wildtype (upper) and mutant (lower) samples. The corresponding ideogram for chr1 is displayed between the KRAS wildtype and mutant tracks and is colored based on reported gram-staining patterns. d Oncoprint summarizing somatic SNV/indel, CNV, and fusion landscape in metastatic PDAC tumors. For each gene, CNV tracks are shown immediately below each SNV track. Fusion genes are shown in the bottom-most four tracks. KRAS wildtype mPDAC tumors are shown on the far right. Upper bars represent tumor mutational burden (TMB) levels. Source data are provided as a Source Data file.

