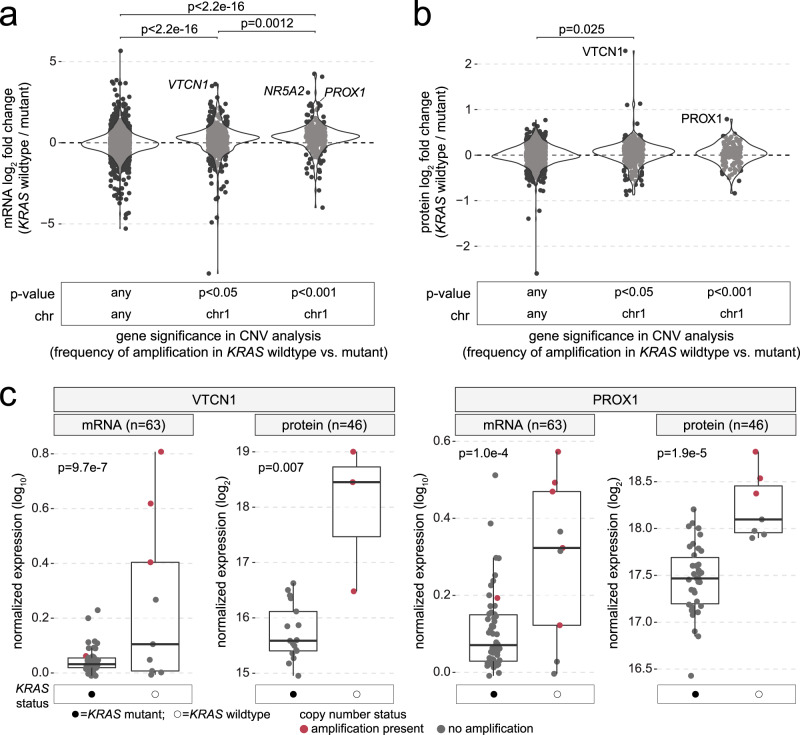
Fig. 4. VTCN1 and PROX1 are increased in KRAS wildtype mPDAC at both mRNA and protein levels.
a Violin plots showing distribution of mRNA expression fold changes (log2; KRAS wildtype vs. mutant) for genes grouped according to results of CNV analysis between KRAS wildtype versus mutant tumors. Left to right: genes located on any chromosome with no difference in rate of copy amplification in KRAS wildtype tumors, genes located on chr1 with a significantly higher rate of copy amplification in KRAS wildtype tumors above thresholds of p < 0.05 and p < 0.001. Each dot represents a gene. Two-tailed Wilcoxon mean rank-sum p values are shown. b Violin plots showing the distribution of protein-level fold changes (log2; KRAS wildtype vs. mutant) for genes grouped according to results of CNV analysis between KRAS wildtype versus mutant tumors. Two-tailed Wilcoxon mean rank-sum p values are shown. c Box plots comparing mRNA and protein levels between KRAS wildtype and mutant groups for VTCN1 (mRNA: KRAS wildtype n = 9, KRAS mutant n = 54; protein: n = 3 and n = 17) and PROX1 (mRNA: n = 9, n = 54; protein: n = 7 and n = 38). Each dot represents a sample, and dots are colored based on whether copy amplification of the gene was present. Box plots indicate median (central line), 25–75% IQR (bounds of box), and whiskers extend from box bounds to the largest value no further than 1.5 times the IQR. Two-tailed Wilcoxon mean rank-sum p values are shown. Source data are provided as a Source Data file.

