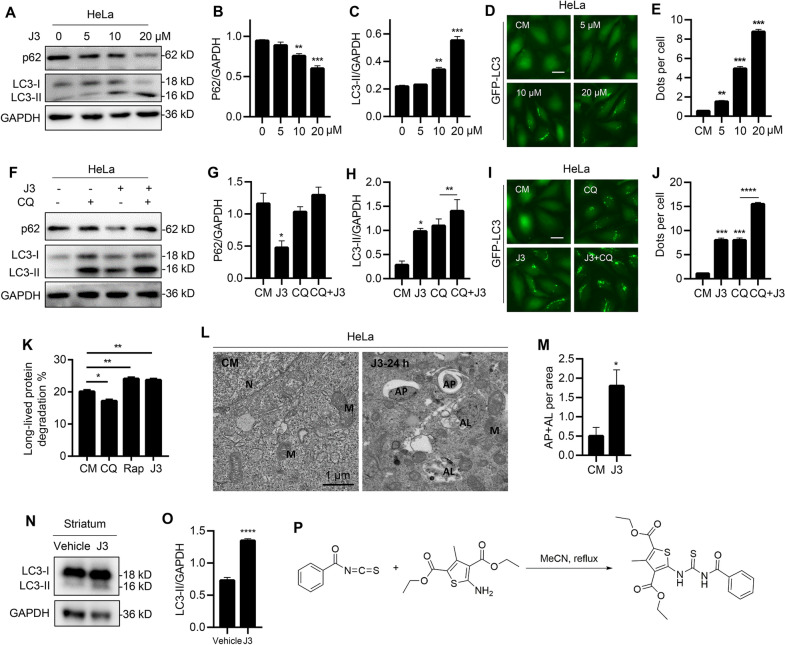
Fig. 1.
Identification of a novel autophagy inducer J3. A WT-HeLa cells were treated with 5, 10, 20 μM of J3 for 6 h, then p62 and LC3 were measured by immunoblotting. B, C The quantification of P62 (B) and LC3 (C) levels at different doses were analyzed. D HeLa cells stably expressing GFP-LC3 were incubated with 5, 10, 20 μM of J3 in complete medium (CM) for 6 h, then GFP-LC3 dots were analyzed. Scale bar = 20 μm. E GFP-LC3 dots from at least 50 cells were counted for quantification of different groups. F WT-HeLa cells were treated with 20 μM of J3 with or without 40 μM of chloroquine (CQ) for 6 h, then p62 and LC3 were analyzed by immunoblotting. G–H Quantification of P62 (G) and LC3 (H) levels of each group were analyzed. I GFP-LC3-HeLa were cultured and treated as F. J Quantification of GFP-LC3 dots was performed. K Hela cells were treated with 1 μM of rapamycin (Rap), 20 μM of CQ, and 10 μM of J3 for 16 h. Long-lived protein degradation assay was performed. L CFP-103Q-HeLa was treated with 20 μM of J3 for 24 h, the autophagosomes and autolysosomes were observed by transmission electron microscopy. N nucleus, M mitochondria, AP autophagosome, AL autolysosome. M Quantification of total AP plus AL per area was performed. Ten areas were analyzed. N Three 10-week-old C57BL/6 mouse were intraperitoneal injected with 30 mg/Kg of J3 daily, after 3 days, mice were sacrificed and the striatum were isolated for western blot analysis. O Quantification of LC3-II protein levels in N were analyzed. P The scheme of the one-step synthesis of J3. Data are presented as mean ± sem from three individual experiments or three different fields. *p < 0.05, **p < 0.01, ***p < 0.001

