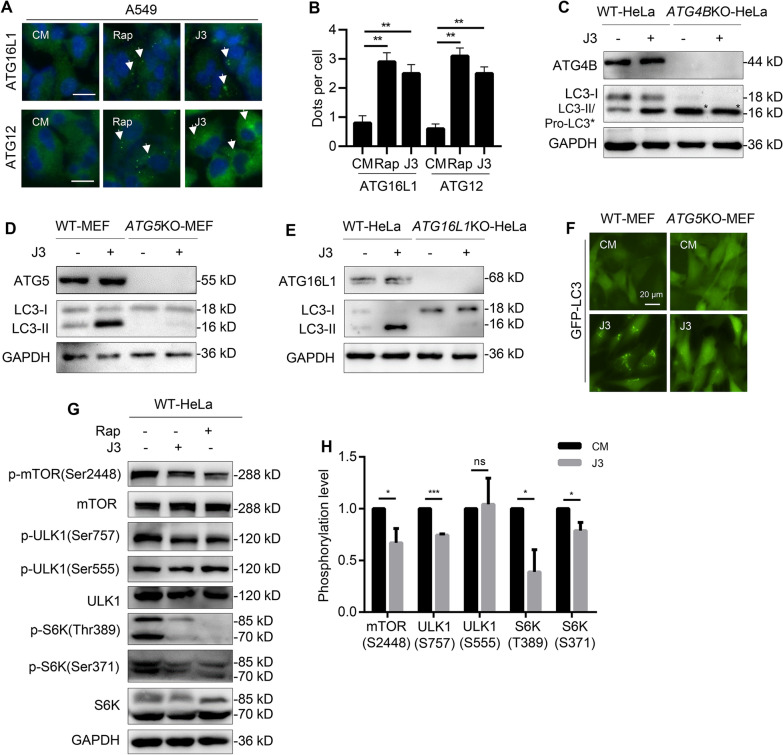
Fig. 2.
J3 inhibits mTOR pathway. A WT-A549 were treated with 20 μM of J3 or 1 μM of Rap for 6 h followed by immunostaining of ATG16L1 and ATG12. ATG16L1 and ATG12 positive structures were indicated by arrowhead. Scale bar = 20 μm. B ATG16L1 or ATG12 dots from at least 50 cells were counted for quantification of different groups. C WT and ATG4B-deficient HeLa cells were incubated with 20 μM of J3 for 6 h, then ATG4B, LC3-I, LC3-II (in WT-HeLa), and pro-LC3 (in ATG4B-deficient HeLa, with asterisk) were analyzed by immunoblotting. D WT and ATG5-deficient MEF cells were incubated with 20 μM of J3 for 6 h, then ATG5, LC3-I, and LC3-II were analyzed by immunoblotting. E WT and ATG16L1-deficient HeLa cells were incubated with 20 μM of J3 for 6 h, then ATG16L1, LC3-I, and LC3-II were analyzed by immunoblotting. F WT- and ATG5KO-MEF cells stably expressing GFP-LC3 were treated by 20 μM of J3 for 6 h. The distribution of GFP-LC3 dots was analyzed. G WT-HeLa cells were treated with 20 μM of J3 or 1 μM of Rap for 6 h. The total protein level and the phosphorylation level of mTOR, ULK1, and S6K were analyzed by immunoblotting as indicated. H Cells were treated as G, then relative phosphorylation level of each protein was calculated. Data are presented as mean ± sem from three individual experiments. *p < 0.05, ***p < 0.001, ns means not significant

