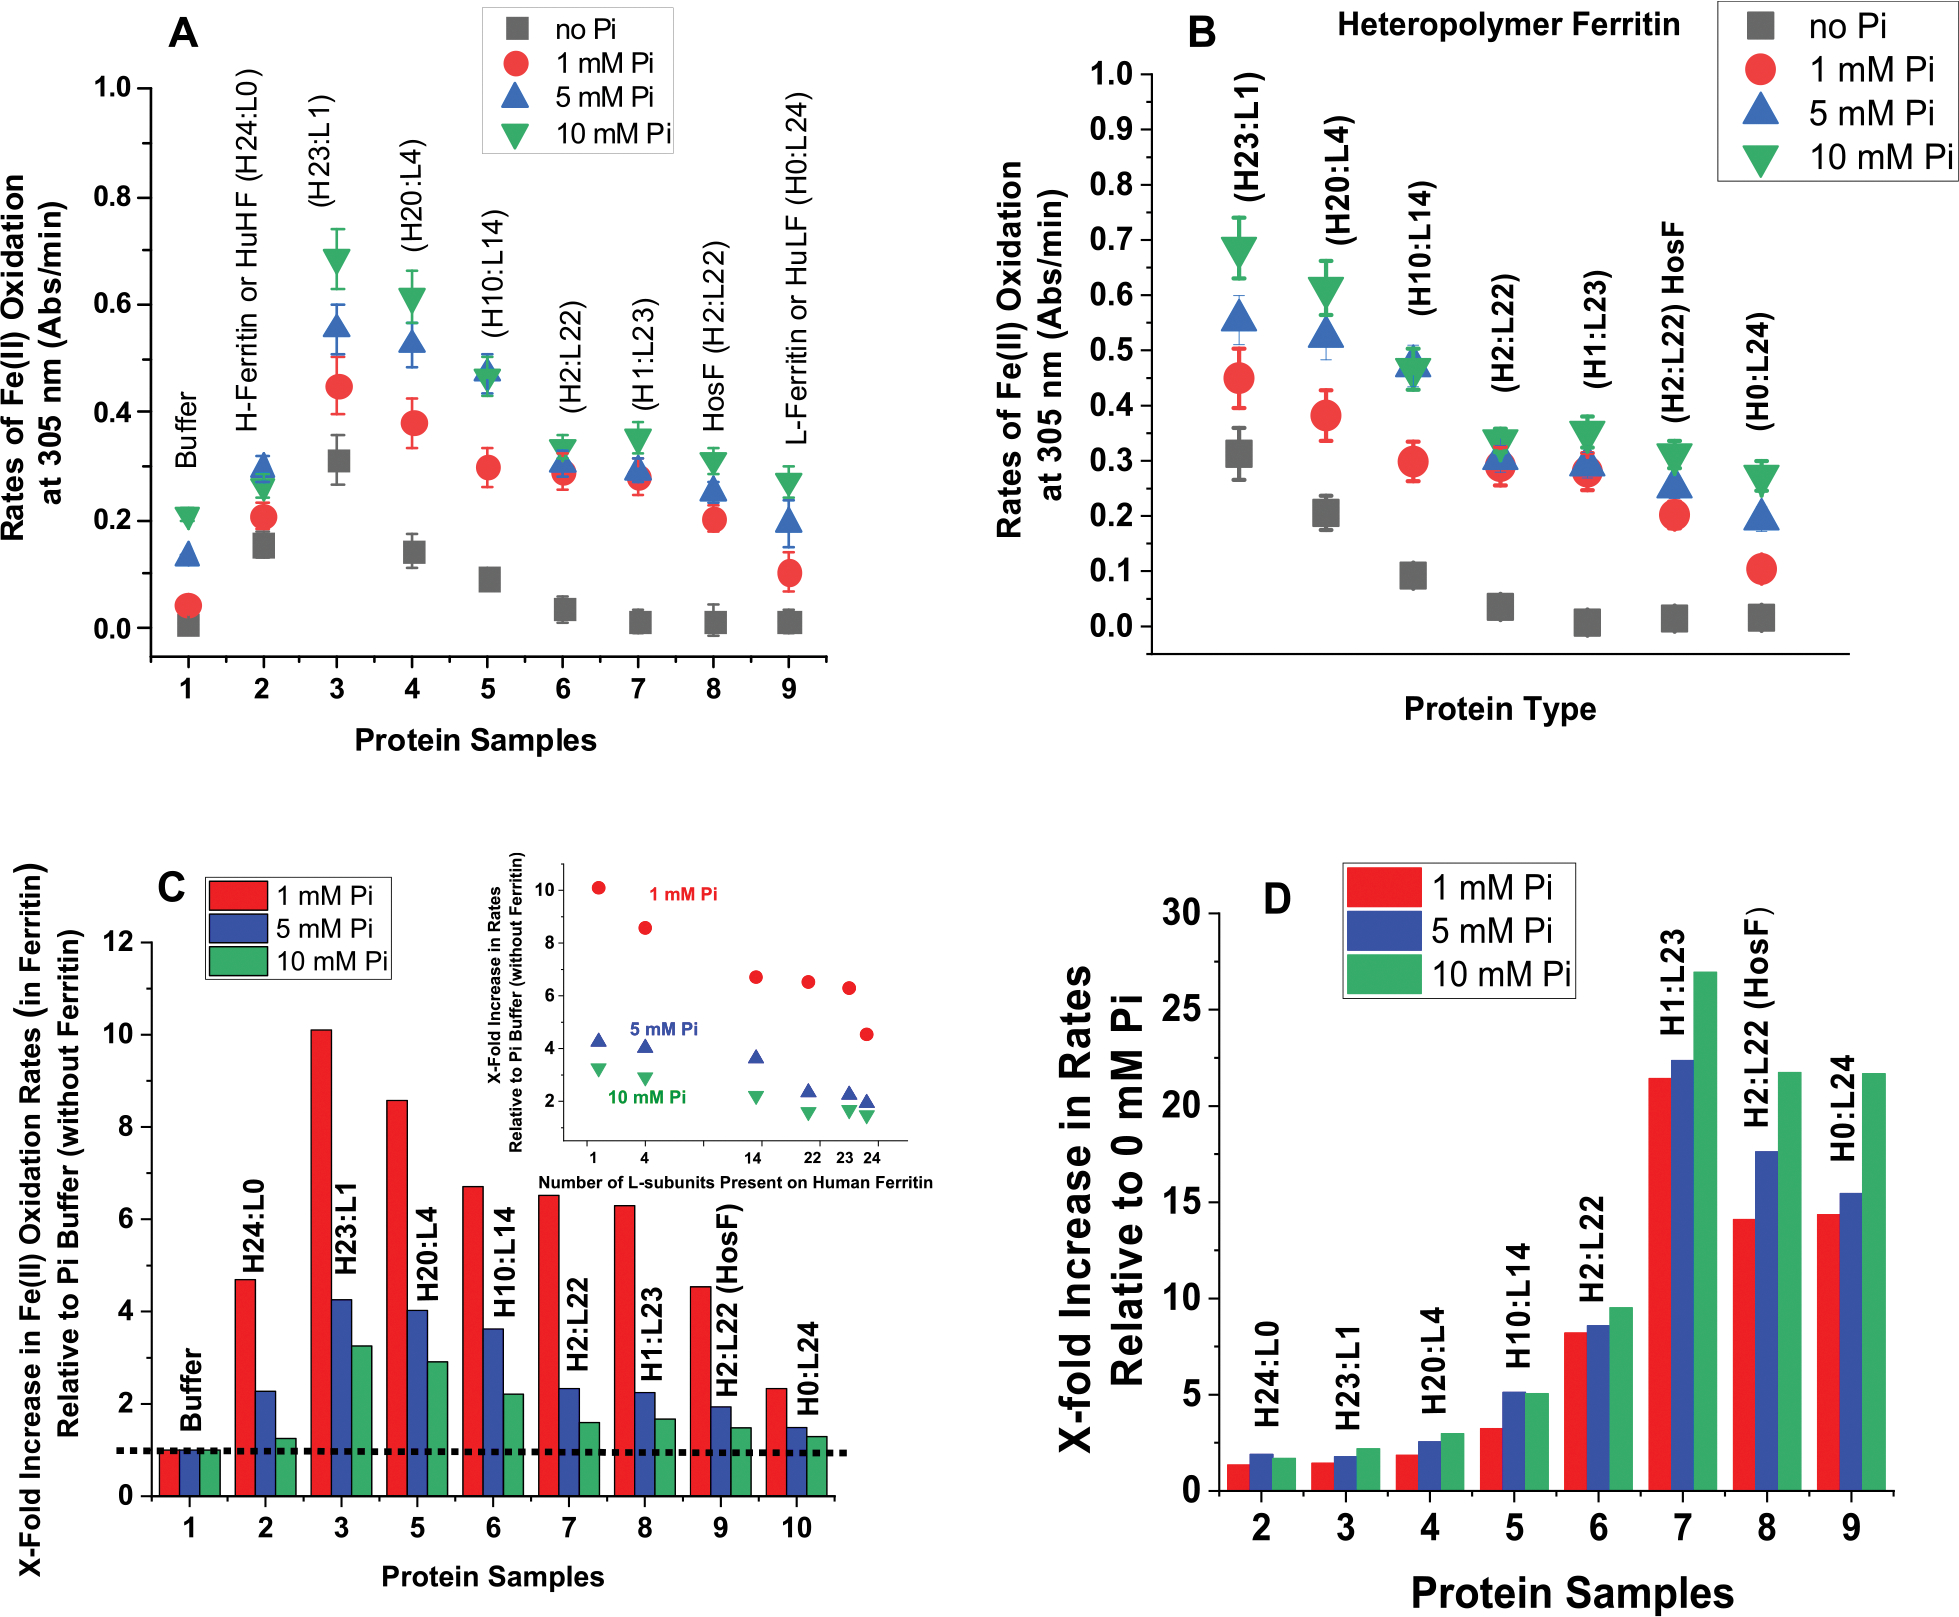
Figure 2.

(A,B) Plots of Fe(II) oxidation rates as a function of ferritin type. (C) Normalized rates of Fe(II) oxidation in different types of ferritin in 1 mM (red), 5 mM (blue), and 10 mM (green) phosphate buffer relative to those in the absence of ferritin. (D) Normalized Fe(II) oxidation rates in ferritin in 1 mM (red), 5 mM (blue), and 10 mM (green) phosphate buffer relative to those in the absence of phosphate. The inset of (C) shows a linear decrease in Fe(II) oxidation rates as a function of the number of L-subunits present in human ferritin. The dotted line in (C) illustrates the Fe(II) oxidation rates in phosphate and represents our baseline. The experimental conditions are the same as those of Figure 1.
