
FIGURE 3.
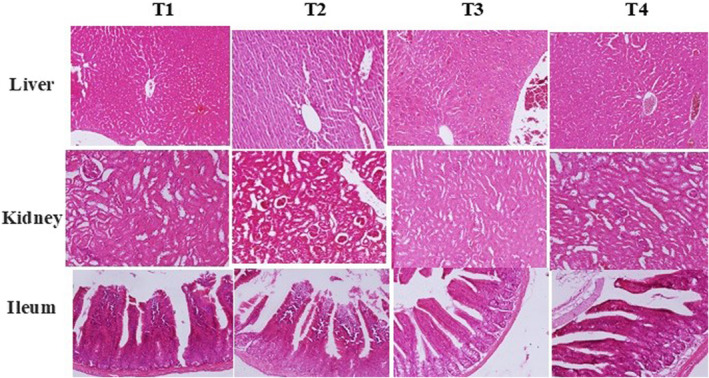
Histopathological analysis of liver, kidney, and ileum of the mice received different treatments. T1, normal diet; T2, normal diet + infected by C. jejuni on day 21; T3, normal diet enriched by a nonencapsulated phenolic rich fraction (10 mg TPC/kg BW/day) + infected by C. jejuni on day 21; T4, normal diet enriched by a nanoliposome‐encapsulated phenolic rich fraction (10 mg TPC/kg BW/day) + infected by C. jejuni on day 21