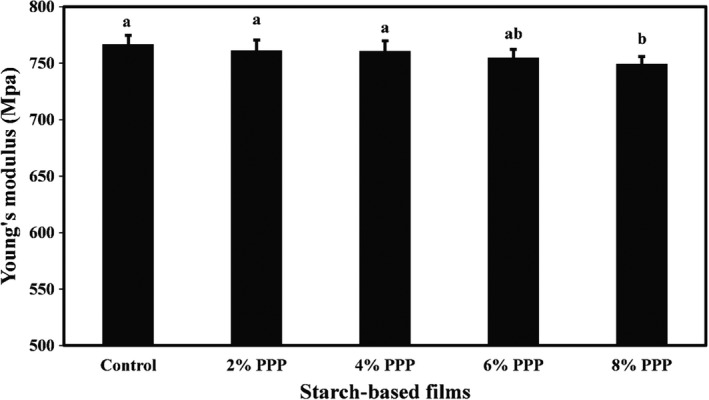
FIGURE 3.

Comparison of elongation at break point (%) mean values of cassava starch‐based films containing different levels of pomegranate peel powder. Bars represent mean (n = 3) ± standard deviation. Different letters on the bars indicate a significant difference at 5% level of probability among film samples. PPP: pomegranate peel powder
