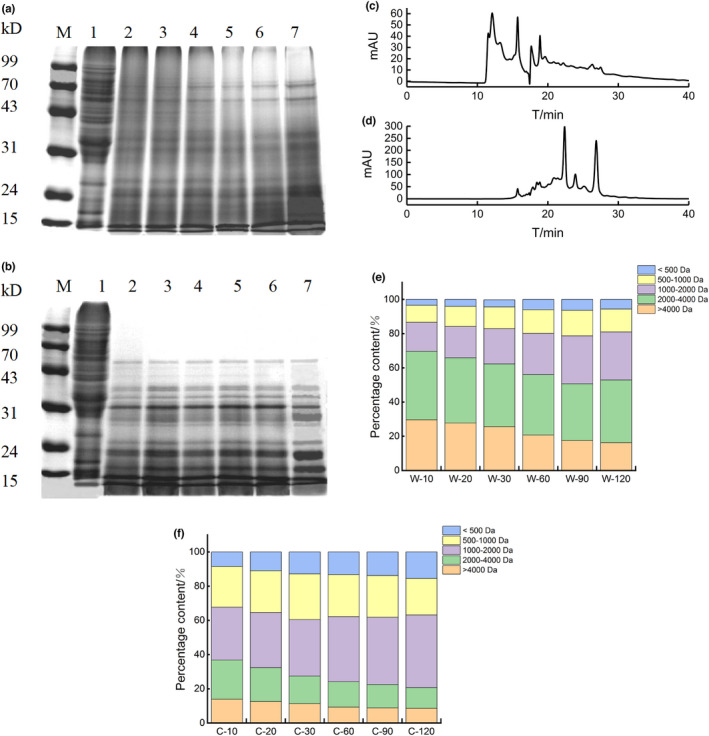
FIGURE 4.

SDS‐PAGE profiles of GWP digested by pepsin (a)/pepsin and trypsin (b) at different times, M: Maker; lane 1: GWP; lane 2–7: pepsin/pepsin and trypsin digestion for 10, 20, 30, 60, 90, and 120 min. Elution profiles of GWP were obtained with pepsin (c)/pepsin and trypsin (d) at 120 min, respectively. MW distribution of GWP digested by pepsin (e)/pepsin and trypsin (f) at a different time
