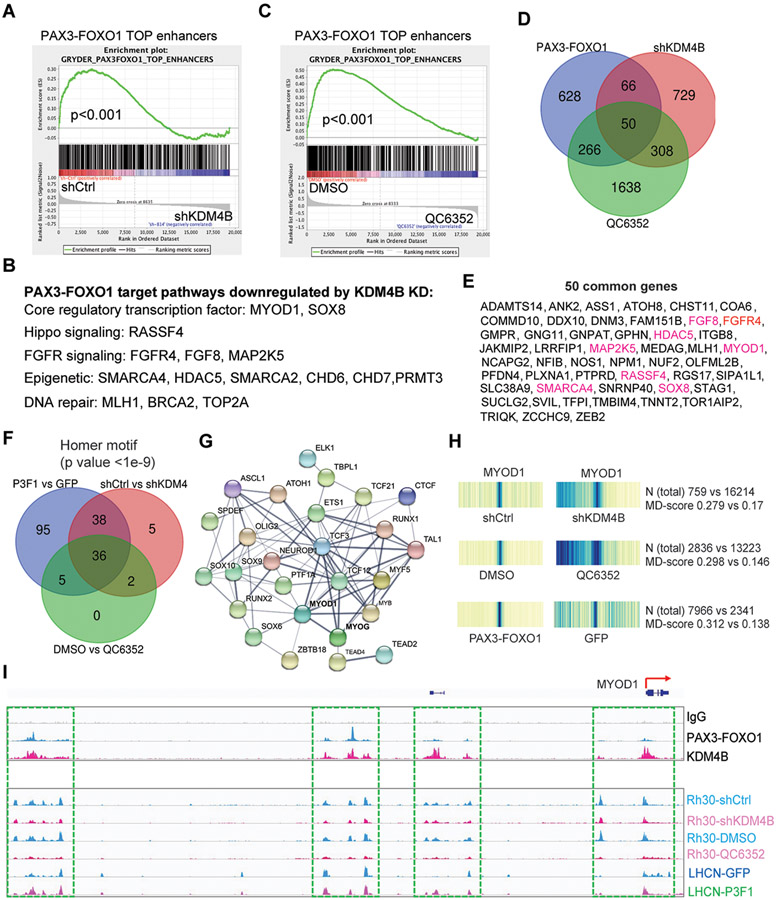
Fig. 5. KDM4B regulates expression of PAX3–FOXO1 target genes and the chromatin accessibility of myogenic program genes governed by MYOD1.
A. Pathway enrichment analysis by GSEA for the genes downregulated by depletion of KDM4B in Rh30 cells.
B. Functions for genes downregulated by KDM4B knockdown in Rh30 cells.
C. Pathway enrichment analysis by GSEA for the genes downregulated by QC6352 treatment of Rh30 cells.
D. Venn diagram for PAX3–FOXO1 target genes and those downregulated by knockdown of KDM4B and QC6352 treatment of Rh30 cells.
E. The 50 common genes listed in Panel (D). Genes highlighted in red color indicate those described in the pathways descirbed in Figure 5D.
F. Venn diagram showing the common transcription factor motifs based on ATAC-seq peaks among those increased by PAX3–FOXO1 in LHCN-M2 cells and those downregulated by knockdown of KDM4B or QC6352 treatment of Rh30 cells.
G. STRING analysis showing the protein-protein interaction (PPI) network of the common transcription factors in Panel (F). PPI enrichment p-value <1.0-e16.
H. Heatmap showing the motif displacement distribution of MYOD1 (increasingly dark blue indicates increasing frequencies of the motif), MD-score and the number of this motif within 1.5 kb of an ATAC-seq peak before and after KDM4B knockdown or QC6352 treatment in Rh30 cells, or after ectopic overexpression of PAX3–FOXO1 in LHCN-M2 cells.
I. Snapshot of using the IGV program displaying the PAX3–FOXO1 and KDM4B binding peaks in Rh30 cells by CUT&RUN (top), and ATAC-seq peaks at the MYOD1 genomic locus before and after KDM4B knockdown or QC6352 treatment of Rh30 cells, or ectopic overexpression of PAX3–FOXO1 in LHCN-M2 cells (bottom).

