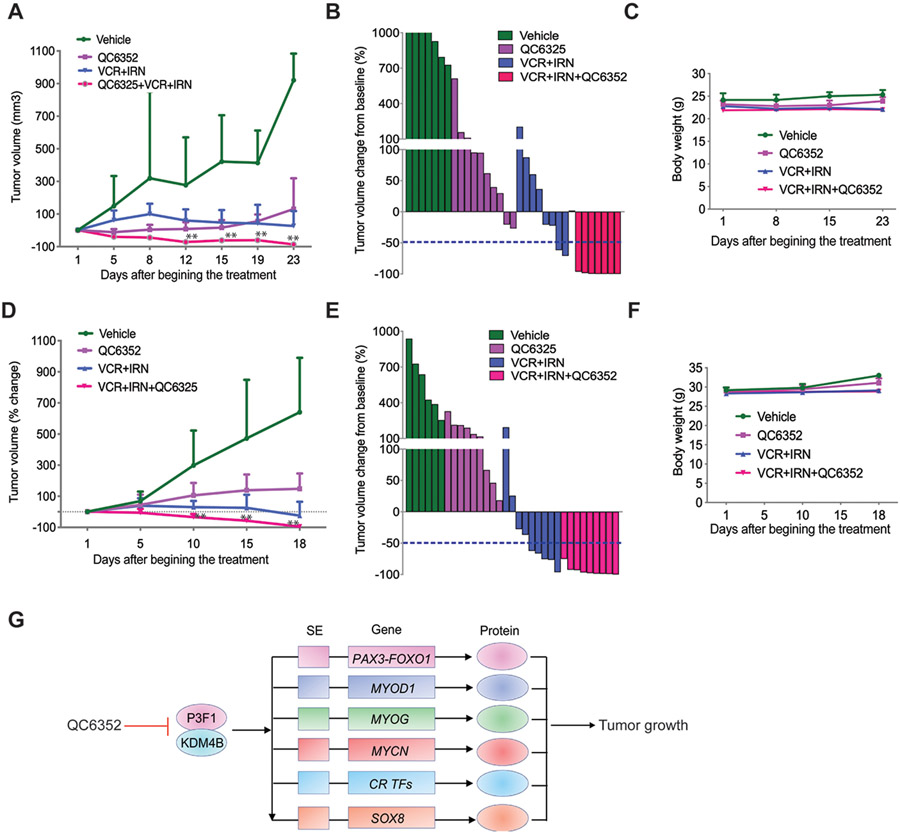
Fig. 7. Combination of QC6352 and conventional chemotherapy significantly enhances efficacy against PAX3–FOXO1 aRMS.
A. Growth curve of Rh41 tumors in NSG mice treated with vehicle (n=7), QC6352 (n=10), VCR/IRN (n=8), or QC6352/VCR/IRN (n=7) for 3 weeks. Wilcoxon rank sum test (two-sided) was used to compare outcome of the two groups at each time point. ** p<0.05 when comparing QC6352/VCR/IRN with QC6352 or VCR/IRN.
B. Waterfall plot of response to treatment. The blue dotted line indicates complete response (CR).
C. Mouse body weight during treatment course.
D. Growth curve of Rh30R PDX tumors in NSG mice treated with vehicle (n=6), QC6352 (n=9), VCR/IRN (n=9), or QC6352/VCR/IRN (n=9) for 3 weeks. Wilcoxon rank sum test (two-sided) was used to compare outcome of the two groups at each time point. ** p<0.05 when comparing QC6352/VCR/IRN with QC6352 or VCR/IRN.
E. Waterfall plot of response to treatment. The blue dotted line indicates complete response (CR).
F. Mouse body weight during treatment course.
G. Model of how KDM4B regulates the PAX3–FOXO1-driven core regulatory transcription factor network.

