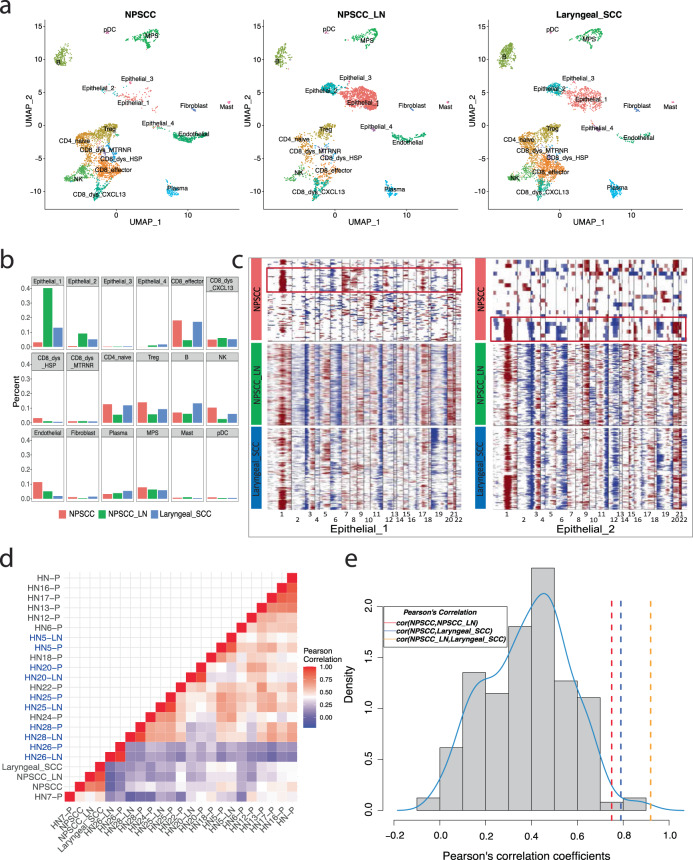
Fig. 2. Copy number alteration profiles suggest the newly developed laryngeal SCC is a metastasis from the NPSCC, as opposed to a new primary tumor.
a UMAP plots and b bar graphs show different cell compositions among three tumors. Dysfunctional CD8+ T cells were split into three subtypes by their marker genes: CD8_dys_CXCL13 with marker gene CXCL13, CD8_dys_HSP with heat shock proteins, and CD8_dys_MTRNR with mitochondrially encoded RNA genes. NPSCC and NPSCC lymph node have distinct components of malignant cells especially Epithelail_1 and Epithelial_2 clusters, demonstrating the inter-tumor heterogeneity. c Heatmap of copy number alteration profiles inferred from two main malignant cell clusters of three tumors using T cell and B cell as “normal” references. Dark red indicates genomic amplifications and blue indicates deletions. The x-axis shows all autosomes in numerical order. The y-axis displays epithelial cells from different tumors (left: Epithelial_1; right: Epithelial_2). Nearly identical copy number alterations observed between the NPSCC lymph node and the laryngeal SCC are similar to those of subclones of the NPSCC tumor (red box). d Heatmap of Pearson’s correlation matrix of 23 HNSCC tumors’ CNA profiles. Correlation coefficients were calculated using mean CNA levels of tumors inferred from scRNA-seq using inferCNV. Five matched pairs of primary tumors (-P) and lymph node metastases (-LN) are in blue font. Matched pairs and three HNSCC tumors investigated in this study show higher similarity within the pairs (red squares), than between unpaired tumors. e Histograms of Pearson’s correlation coefficients of non-paired HNSCC tumors’ CNA profiles, excluding the five matched pairs and three tumors investigated in this study. Three tumors investigated here show higher similarity (r = 0.75, 0.79, and 0.92) than that would be expected randomly, with one-sided p-values of 0.023, 0.013, and 0.0017, respectively.

