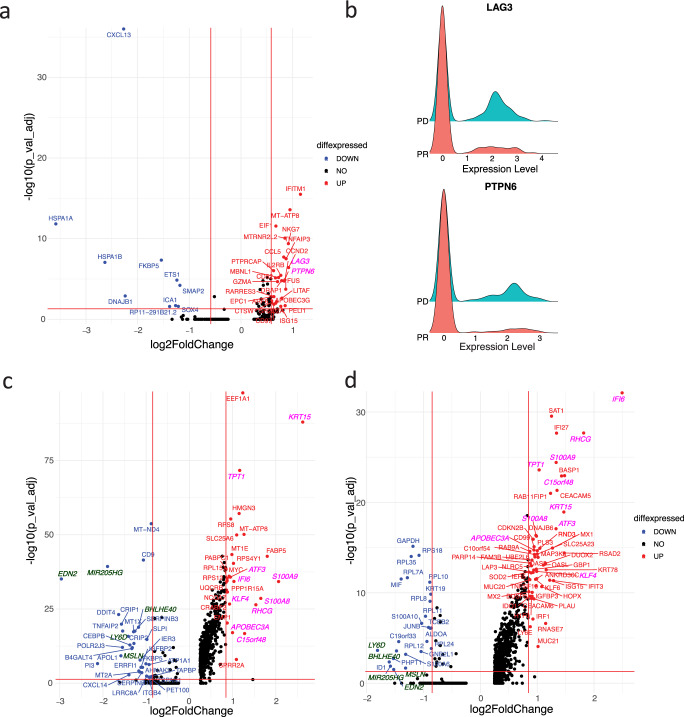
Fig. 3. Increased expression of T cell exhaustion markers LAG3 and PTPN6, APOBEC3A, and interferon-inducible protein IFI6 in the progressing laryngeal SCC.
a Volcano plot of differentially expressed genes in dysfunctional CD8+ T cell (CD8_dys_CXCL13) in laryngeal SCC vs NPSCC and NPSCC lymph node shows increased expression of two T cell exhaustion markers LAG3 and PTPN6 (italicized pink font) in laryngeal SCC. Only genes with log2FoldChange larger than 0.25 were shown. Wilcoxon Rank Sum tests were performed and p values were adjusted by Bonferroni correction. Horizontal red line: −log10(0.05); vertical red lines: +/−log2(1.5). b Ridge plots of expression of LAG3 and PTPN6 in tumors with fold changes of 1.80, 1.79 and adjusted p values of 1.3e−5, 1.8e−5, respectively, comparing the laryngeal SCC (PD) to two regressing lesions (PR). c, d Volcano plots of differentially expressed genes in Epithelial_1(C) and Epithelial_2(D) in laryngeal SCC vs NPSCC and NPSCC lymph node. Commonly upregulated and down-regulated genes in laryngeal SCC were shown in italicized pink and dark green fonts, respectively, supporting increased APOBEC3A expression stimulated by interferon signaling. Horizontal red line: −log10(0.05); vertical red lines: +/−log2(1.8).

