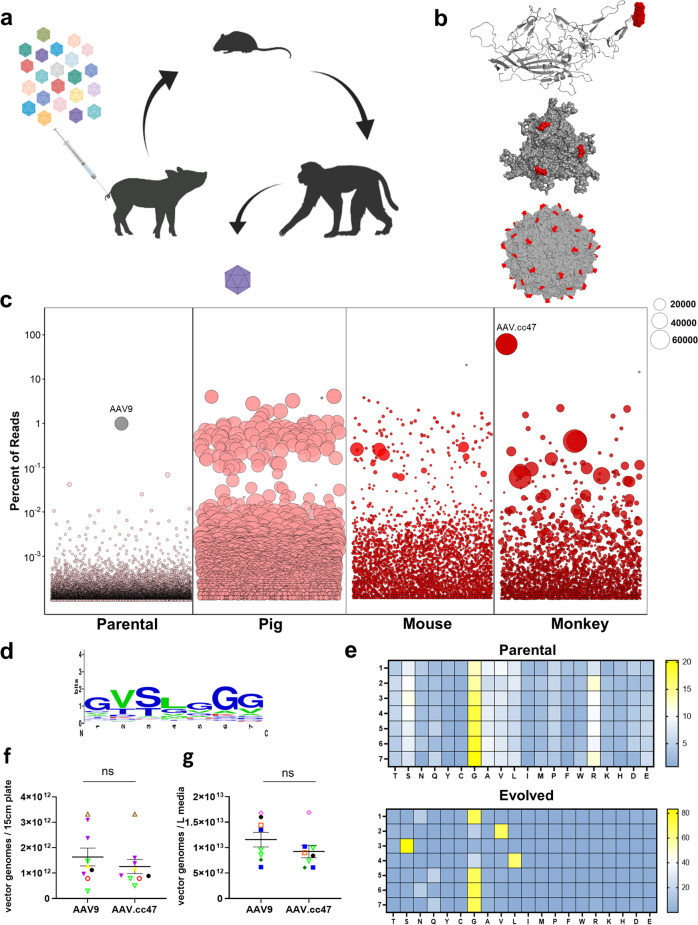
Fig. 1. Cross-species evolution of AAV capsid libraries yields a dominant new variant.
a Schematic of AAV capsid library evolution in pigs, mice, and non-human primates following intravenous dosing b AAV9 VP3 monomer, trimer, and full capsid identifying the 7 amino acid residues mutated in our capsid library (red). The images were generated using PyMOL. c Next-generation sequencing identifies AAV.cc47 as the top enriched AAV variant following three rounds of evolution in each animal species. Each amino acid sequence was assigned a random number 1–1000 and is plotted on the x-axis, and the y-axis represents the percent of reads of each sequence in the library. The bubbles represent an individual amino acid sequence and its size corresponds to the fold enrichment of each sequence in the evolved library compared to the parental library. d Consensus motif analysis of the top 100 enriched AAV mutants following three rounds of evolution, for residues 452 − 458 (VP1 numbering). e Heat map of parental and final evolved libraries identifying amino acid frequencies at each library position following in vivo cycling of libraries. f, g Comparison of multiple recombinant AAV9 or AAV.cc47 production yields in both adherent (n = 9) and suspension (n = 15) HEK293 systems. Final, post-purified AAV yields from adherent 293 s are plotted as vector genome titers per 15 cm plate and from suspension HEK293s are plotted as vector genome titers per liter of media. Data points represented here consist of vectors packaging the same transgene cassette for AAV9 and AAV.cc47. Each symbol and color combination represents a different transgene cassette used for vector preparation, the dash represents the mean value and error bars represent the standard error mean. Vectors that were single-stranded genomes include black circles, yellow triangles, open red circles, open brown triangles, and purple triangles. Vectors that were self-complementary genomes include open upside-down light green triangles, blue square, open orange square, dark green diamond, and open pink diamonds. Statistical significance was determined by a two-tailed paired Student t Test (Adherent, P < 0.081; Suspension, P < 0.056). ns not significant. Source data are provided as a Source Data file.

