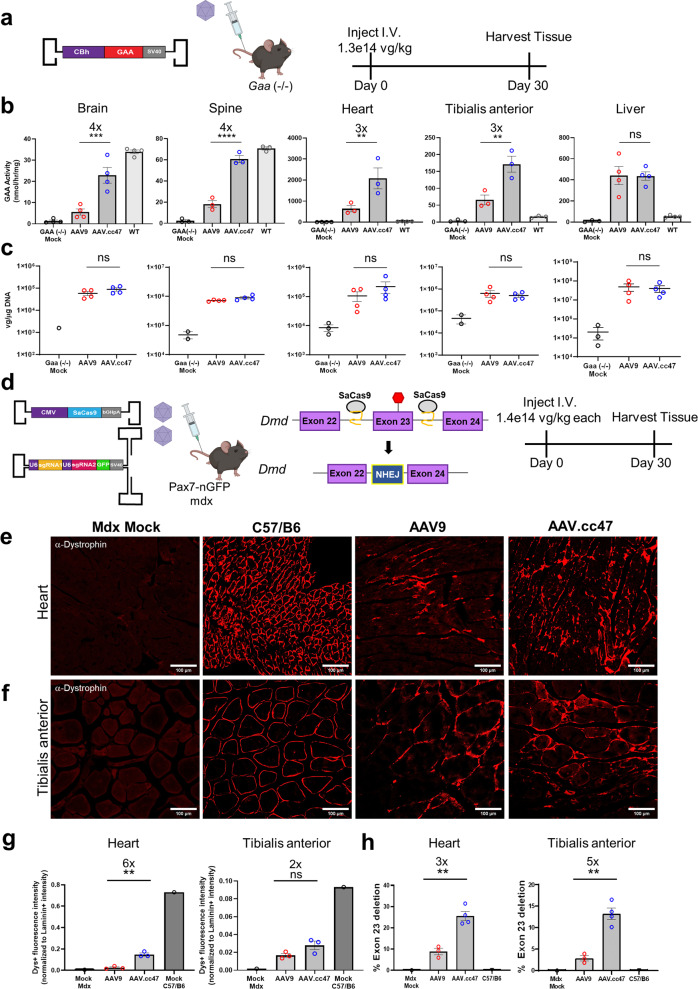
Fig. 6. Systemic administration of AAV.cc47 leads to increased Acid alpha-glucosidase (GAA) expression in the Pompe mouse model and enhanced restoration of dystrophin through genome editing in mdx mice compared to AAV9.
a Pompe study schematic. 8–10 week old Gaa (−/−) mice (n = 4) were injected with 1.3e14vg/kg of a single stranded AAV genome expressing the human acid alpha-glucosidase gene driven by the CBh promoter. b GAA enzyme activity was quantified in tissues of AAV9 (red) or AAV.cc47 (blue) treated Gaa (−/−) mice. Data is represented as nmol per hour activity per mg BSA protein. c Vector genome copy numbers per μg DNA were calculated by normalizing SV40 polyA copy numbers to total μg DNA input for qPCR quantification and are represented as log vg/μg DNA. GAA enzyme levels for different brain and spinal cord regions are summarized in analysis. d Mdx study schematic. 8–10 week old Pax7-nGFP mdx mice (n = 4) were injected with a total dose of 2.8e14 vg/kg consisting of a single-stranded genome expressing SaCas9 driven by the CMV promoter and a self-complementary genome expressing two gRNAs driven by the U6 promoter mixed in a 1:1 ratio. Representative immunofluorescence images for dystrophin (red) in the heart (e) and tibialis anterior (f) from AAV treated Pax7-nGFP mdx mice. Ten micrometres thick and 7μm thick cross sections were obtained via a cryostat for the heart and tibialis anterior, respectively. g Quantification of dystrophin expression intensity normalized to laminin expression intensity in heart and tibialis anterior. h Quantification of exon 23-deleted transcripts in cardiac and skeletal muscles via Taqman quantitative RT-PCR. Statistical significance was determined by One-Way ANOVA with Tukey’s posttest (GAA enzyme brain, P < 0.0003; spine, P < 0.0001, heart, P < 0.0062, tibialis anterior, P < 0.0029, liver, P < 0.9999; Dystrophin histology quantification heart, P < 0.0057, tibialis anterior, P < 0.2700; % Dmd exon 23 deletion heart, P < 0.0075, tibialis anterior, P < 0.0056). Data points included represent an individual mouse for all assays. Fold changes are shown above significance and all graphs represent the mean value and error bars represent the standard error mean. *P < 0.05; **P < 0.01; ***P < 0.001; ****P < 0.0001; ns not significant. Source data are provided as a Source Data file.

