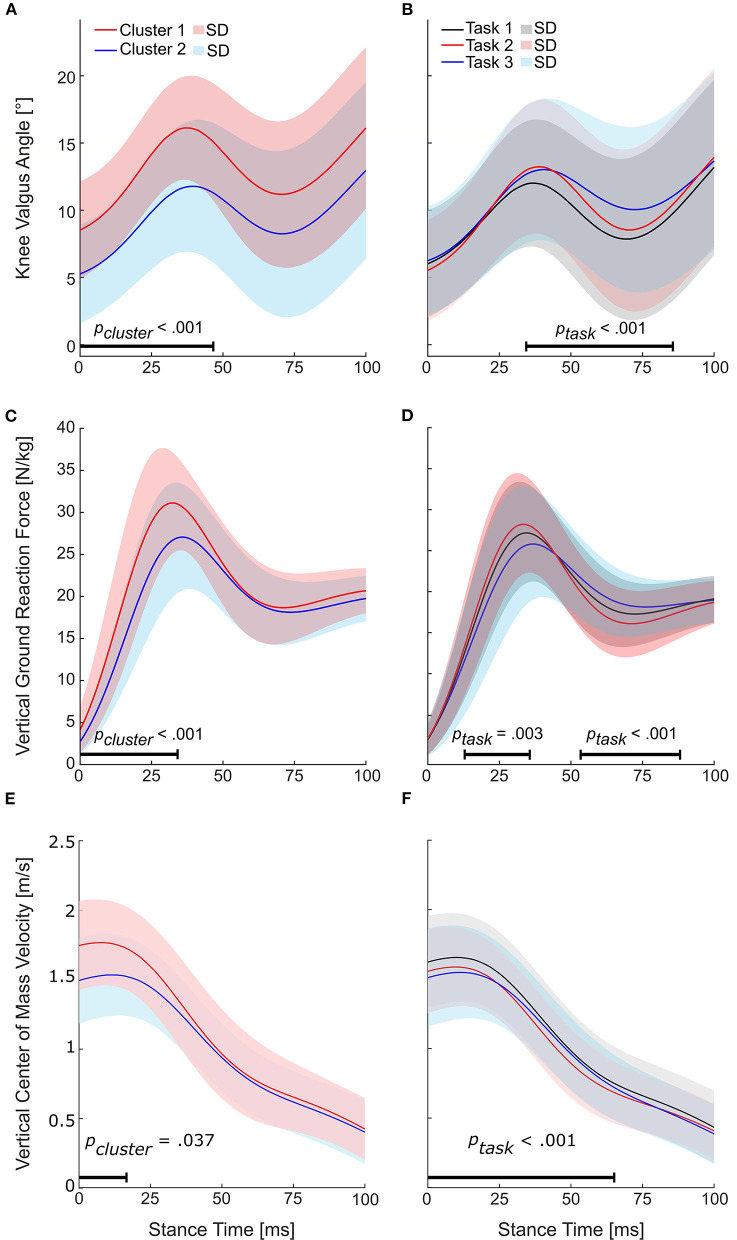
Figure 6.
Results for the nested repeated-measures ANOVAs of statistical parametric mapping (SPM). Horizontal bars indicate the range with a significant cluster (pcluster < 0.05) or task effect (ptask < 0.05). (A) Time series for the knee valgus angles of the identified clusters and (B) tasks. (C) Time series for the vertical ground reaction forces of the identified clusters and (D) tasks. (E) Time series for the vertical center of mass velocities of the identified clusters and (F) tasks.

