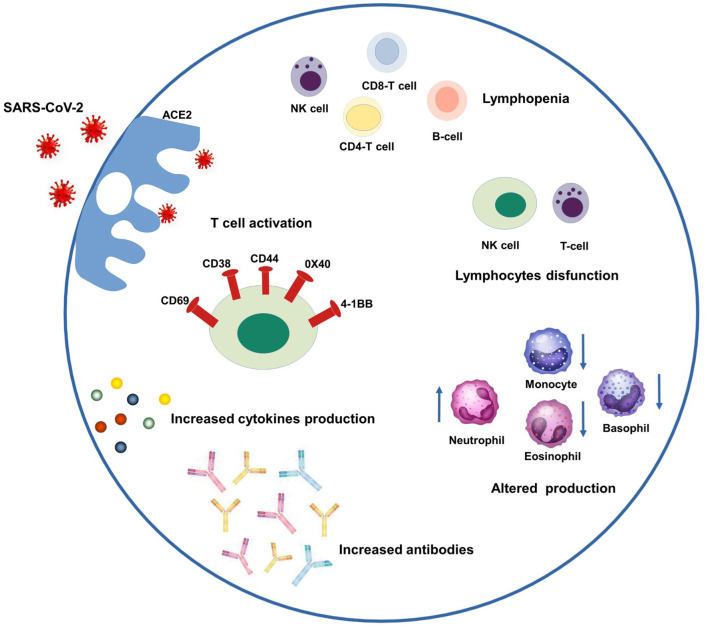
Figure 1.
Schematic representation of COVID-19 immune patterns. In the left-upper part of the scheme, SARS-CoV-2 enters the host's cells through the ACE-2 specific receptor and triggering several patterns. Clockwise from the left they are: T cell activation through a high expression of CD69, CD38, and CD44, 0X40 and 4-1BB; lymphopenia including NK, CD4-T, CD8-T and B-cells; lymphocyte dysfunction including NK and T-cells; monocytes and granulocyte abnormalities (increased neutrophil levels, decreased eosinophil, basophil, and monocyte levels), increased amount of antibodies and cytokines.

