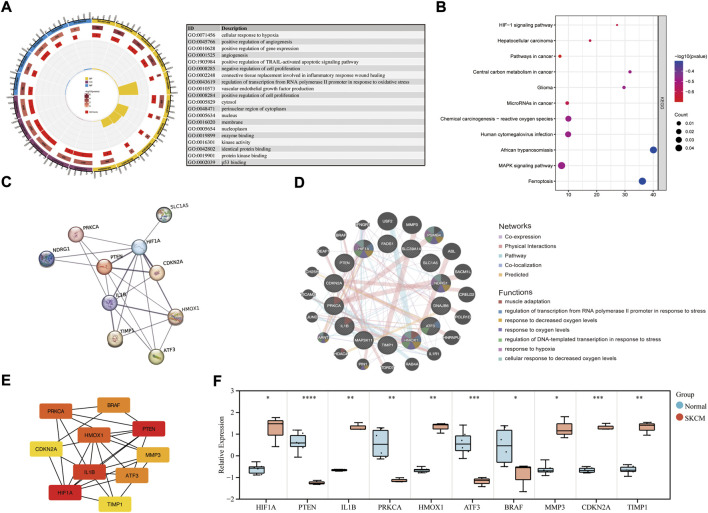
FIGURE 2.
Enrichment analysis of common DEGs and PPI network construction. (A) GO enrichment analysis of common DEGs. (B) KEGG enrichment analysis of common DEGs. (C) PPI network of common DEGs was constructed by STRING. (D) Co-expression PPI networks of common DEGs were constructed by GeneMANIA. (E) The top 10 hub genes in the co-expression network were obtained and visualized with Cytoscape. (F) The mRNA expression level in melanoma cell lines and health controls.

