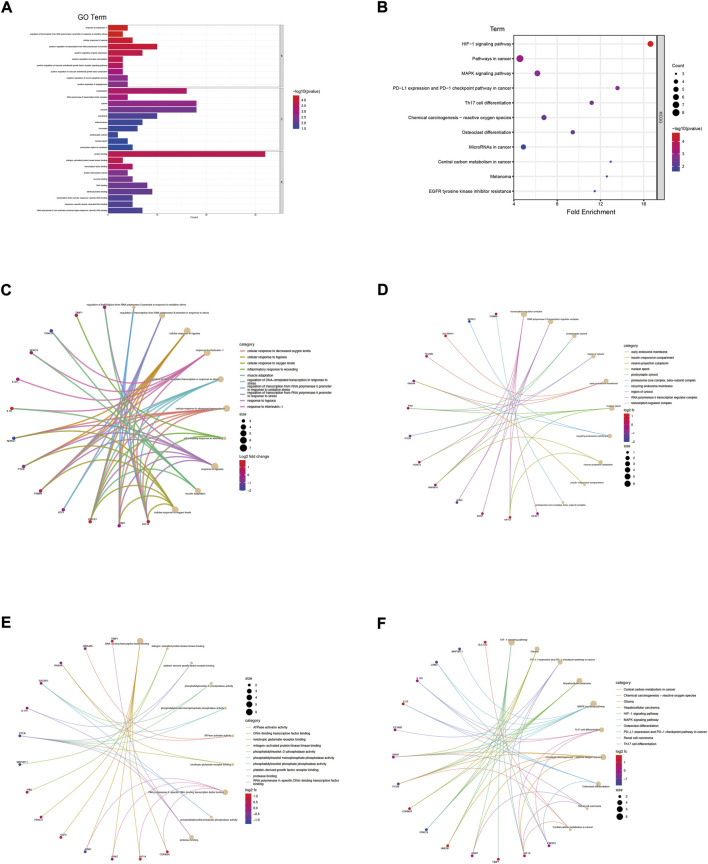
FIGURE 3.
Enrichment analysis of genes in co-expression PPI networks. (A) GO enrichment analysis of these genes. (B) KEGG enrichment analysis of these genes. (C) The category of “biological process” of these genes was displayed by chord diagram. (D) The category of “cellular component” of these genes was displayed by chord diagram. (E) The category of “molecular function” of these genes was displayed by chord diagram. (F) The KEGG pathway enrichment analysis of these genes was displayed by chord diagram.

