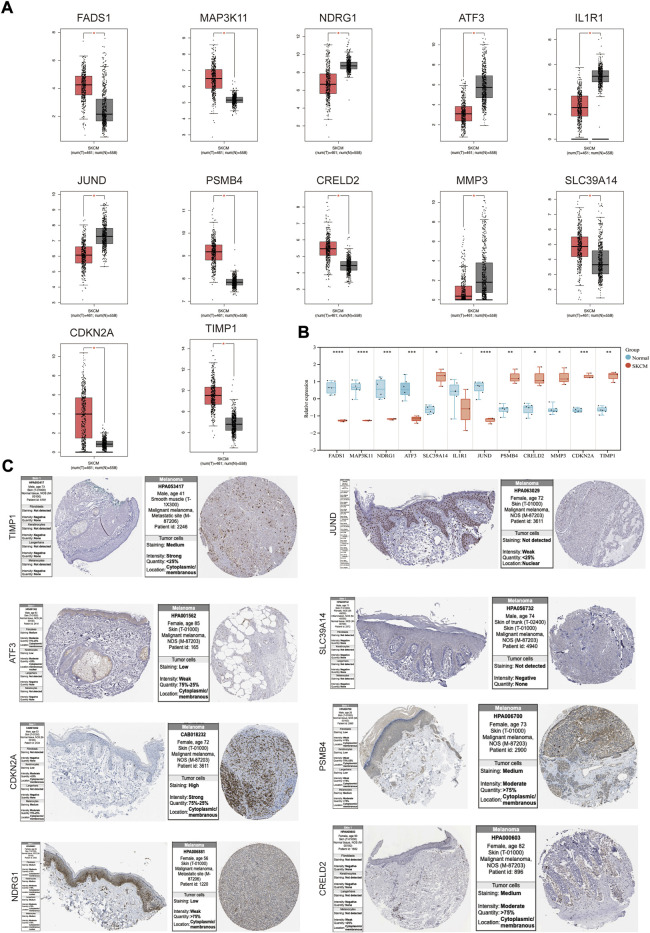
FIGURE 4.
The mRNA and protein expression levels of genes in co-expression networks with melanoma patients. (A) Gene expression profile of genes in co-expression networks in GEPIA. (B) Gene expression profile of these genes in melanoma cell lines and health controls. (C) The protein expression levels of the genes in HPA. *p < 0.05; **p < 0.01; ***p < 0.001; ****p < 0.0001.

