Figure 2.

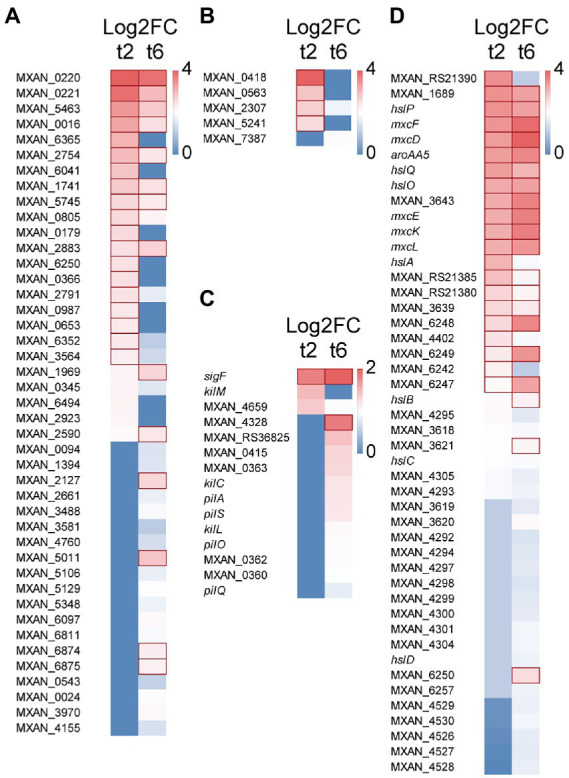
Heatmap with upregulated genes during predation at t2 and/or t6. (A) Hydrolytic enzymes. (B) LysM proteins. (C) S-motility. (D) Secondary metabolites. Red edges indicate genes with Log2 Fold Change > 1.

Heatmap with upregulated genes during predation at t2 and/or t6. (A) Hydrolytic enzymes. (B) LysM proteins. (C) S-motility. (D) Secondary metabolites. Red edges indicate genes with Log2 Fold Change > 1.