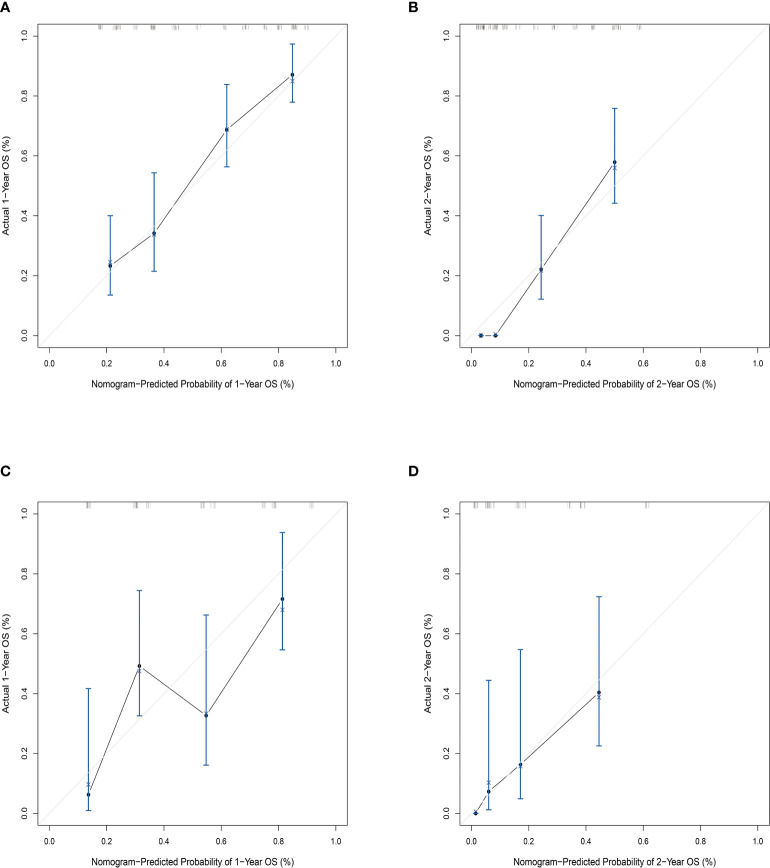
Figure 4.
Calibration plot of the nomogram model comparing predicted probabilities with actual 1- and 2-year survival rates. (A) Calibration plot of 1-year survival prediction in the training set nomogram; (B) calibration plot of 2-year survival prediction in the training set nomogram; (C) calibration plot of 1-year survival prediction in the validation set nomogram; (D) calibration plot of 2-year survival prediction in the validation set nomogram. The c-index in the training set is 0.745, and in the validation set, it is 0.713.

