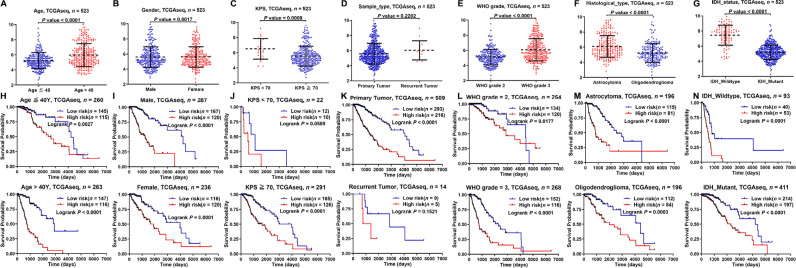
Figure 4.
Kaplan-Meier analysis of survival differences stratified by clinicopathological variables between the low- and high-risk groups in the TCGA database. (A–G) Risk score differences stratified by clinicopathological variables between the low- and high-risk groups; (H–N) Kaplan-Meier analysis of survival differences stratified by clinicopathological variables between the low- and high-risk groups

