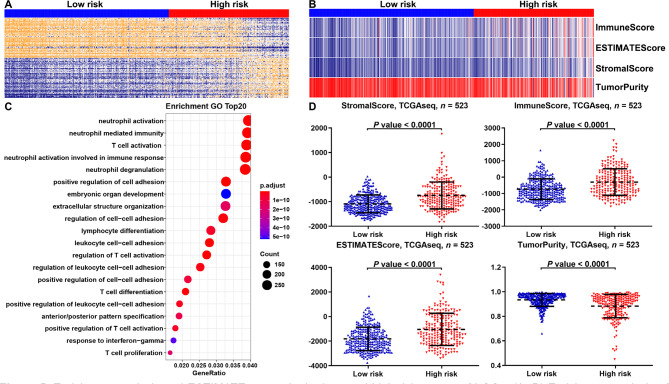
Figure 5.
Enrichment analysis and ESTIMATE scores in the low- and high-risk groups of LGGs. (A, B) Enrichment analysis of DEGs in the low- and high-risk groups of LGGs in the TCGA database. The top 20 items were illustrated in the bubblechart; (C) the heat map displayed the distribution features of ESTIMATE scores between the low- and high-risk groups of LGGs in the TCGA database; (D) the scatter plot depicted the results of the ESTIMATE scores between the low- and high-risk groups

