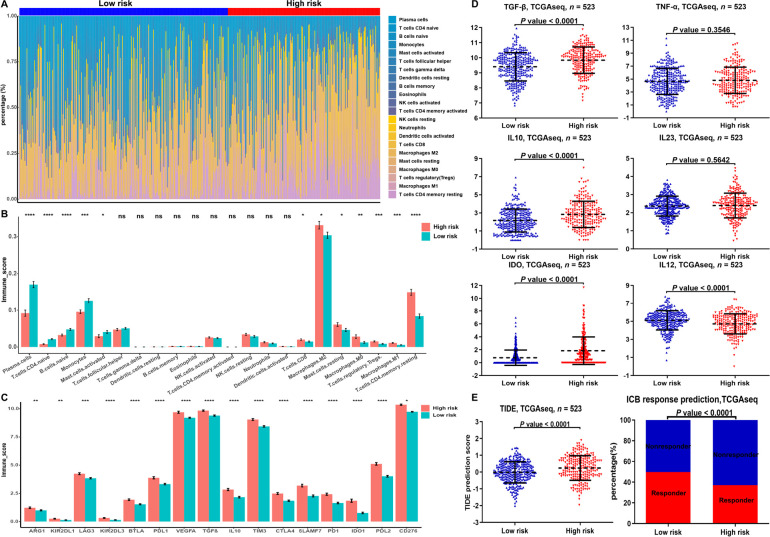
Figure 6.
Proportion of TICs and exhausted immune response markers in the low- and high-risk groups of LGGs. (A) Bar chart showed the percentage of various TICs in the samples from the low-risk and high-risk groups; (B, C) bar chart demonstrated the difference in the expression of various immune cells and exhausted immune response markers between the low-risk and high-risk groups; (D) expression of M1- and M2-associated genes differences between the low- and high-risk groups in the TCGA database; (E) TIDE prediction difference in the high- and low-risk patients, and accumulative bar diagram showed that the LGGs with low-risk group (49.67%, 150/302) were more likely to respond to immune checkpoint blockade (ICB) immunotherapy than the LGGs with high-risk group (37.1%, 82/221). * P < 0.05, ** P < 0.01, *** P < 0.001, **** P < 0.0001

