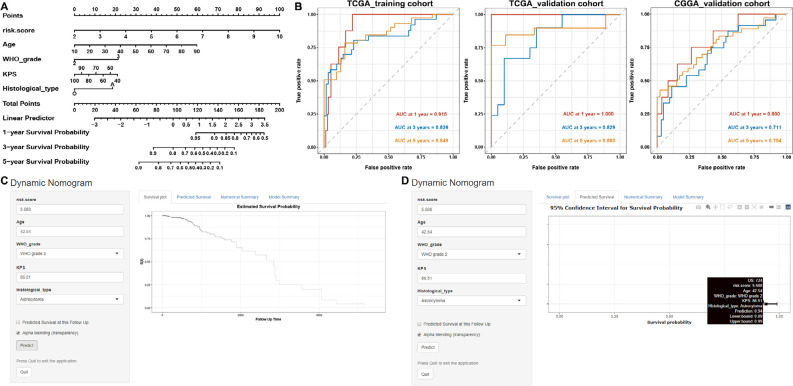
Figure 8.
Construction and evaluation of a prognostic nomogram. (A) The nomogram predicts the probability of the 1-, 2-, and 3-year OS; (B) ROC curve of the nomogram predicts the probability of the 1-, 2-, and 3-year OS; (C, D) online dynamic nomogram accessible at https://fengyuan1993.shinyapps.io/LGG_m6A_Immunotherapy/

