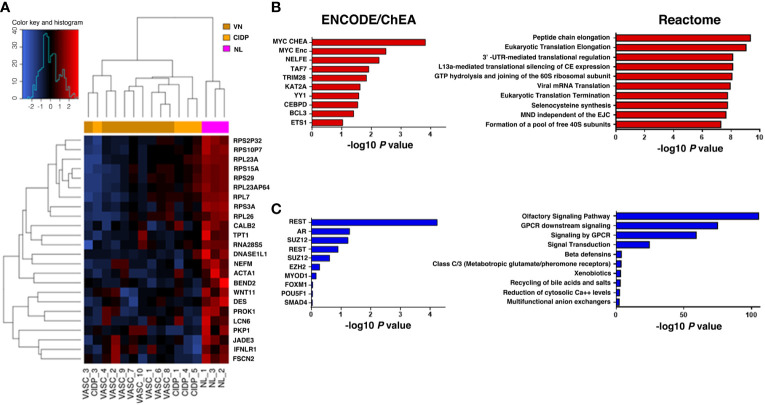
Figure 2.
Heatmap representing hierarchical clustering of the 16 samples (columns) and gene (rows) detected as highly differentially expressed. The expression level of each gene has been standardized by subtracting the gene’s mean expression level and dividing by the standard deviation across all samples. The scaled expression value is plotted in red-blue scale colour, with red indicating higher expression and blue lower expression in NL patients (A). Functional enrichment analysis on upregulated genes (B, red) identified MYC as the top ranked upstream transcription factor in our up-DEGs (ENCODE/ChEA consensus database), while enriched downstream pathways were those related to ribosomal biogenesis and mRNA translation (Reactome database). Downregulated genes (C, blue) were mainly associated with olfactory and GPCR signalling (Reactome database), highlighting REST as the most relevant transcription factor enriched in our analysis (ENCODE/ChEA consensus database).

