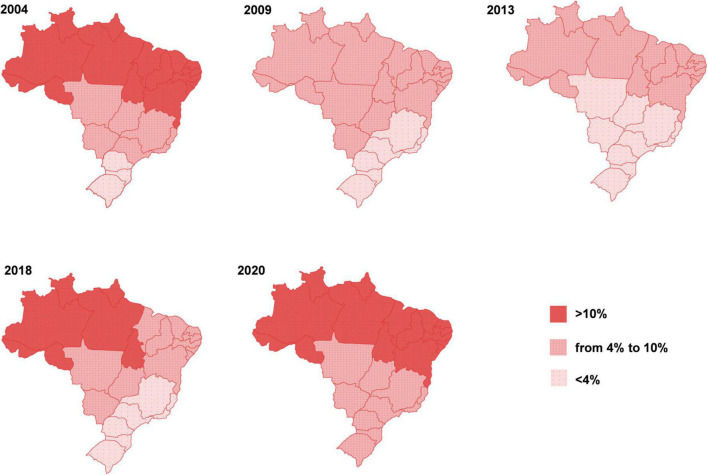
FIGURE 1.
Evolution of hunger in Brazil. The figure shows the percentage of the population affected by severe food insecurity from 2004 to 2020, seen in different macro-regions of the country. Figure reproduced (with permission) from the Report of the National Survey of Food Insecurity in the Context the COVID-19 Pandemic in Brazil published by the Brazilian Research Network of Food and Nutrition Sovereignty and Security (applied herein with permission from Rede PENSSAN, http://olheparaafome.com.br/VIGISAN_Inseguranca_alimentar.pdf).

