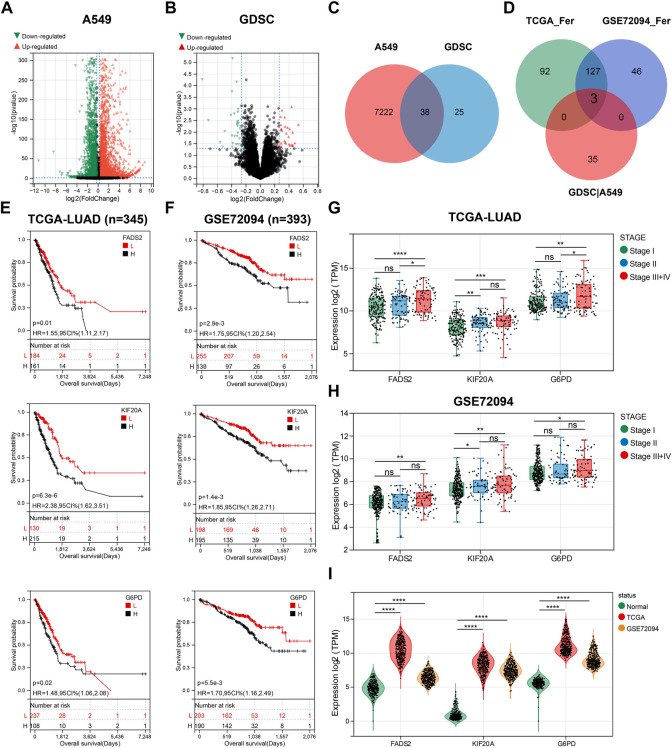
FIGURE 1.
Three GEM response-related prognostic FGRs were screened. (A) A volcano plot of data obtained by RNA-seq comparing A549 cells exposed to GEM and PBS for 48 h. (B) The volcano map showing the DEG between non-sensitive LUAD cells and GEM-sensitive LUAD cells. (C) Venn diagram depicting 38 screened GEM response-related genes. (D) Venn diagram to identify the common FRGs of GEM response-related genes, TCGA-LUAD prognostic FRGs and GES72094 prognostic FRGs. (E,F) K-M curves for OS of LUAD patients with high and low expression groups of the three candidate genes. (G,H) Box plots showed the expression of three candidate genes in different tumor staging samples. (I) Violin plots for comparing the expression levels of three candidate genes in normal lung tissue and LUAD samples. FRGs: ferroptosis-related genes; GEM: Gemcitabine; TCGA_Fer: prognostic FRGs in TCGA-LUAD; GSE72094_Fer: prognostic FRGs in GSE72094; GDSC|A549: the intersection genes of DEGs in GEM-treated A549 and GDSC databases; RNA-seq: RNA sequencing; LUAD: lung adenocarcinoma; K-M analysis: Kaplan-Meier analysis; OS: overall survival; HR: hazard ratio. *p < 0.05; **p < 0.01; ***p < 0.001; ****p < 0.0001; ns p > 0.05.

