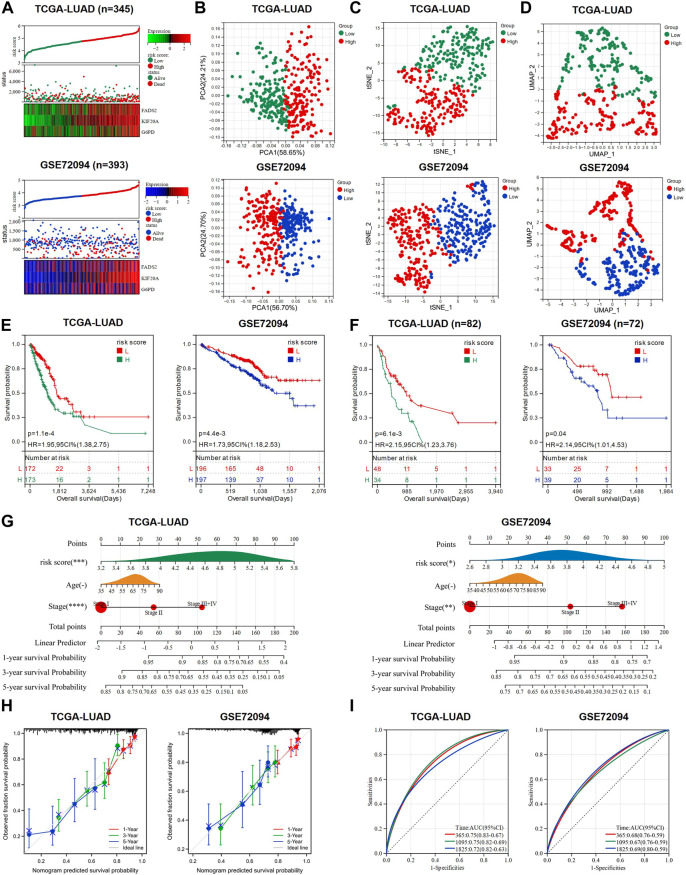
FIGURE 2.
A prognostic model to predict the survival of LUAD patients was constructed and validated. (A) Expression heat map of the three candidate genes, risk score curve and survival status scatter plot for each LUAD patient in training cohort and validation cohort, respectively. (B–D) PCA analysis, t-SNE analysis and UMAP analysis were used to verify the grouping performance of the prognostic model. (E) K-M curves for OS of LUAD patients in the high-risk and low-risk groups. (F) K-M curves for OS of advanced LUAD patients (stage III + IV) in the high-risk and low-risk groups. (G) Nomograms were constructed using three independent prognostic factors (risk score, age, and tumor stage) to predict OS at 1-, 3-and 5-year for LUAD patients. (H) The calibration plots assess the accuracy of the nomogram. (I) AUC of ROC curves for validating the accuracy of risk model 1-, 3- and 5-year survival predictions. LUAD: lung adenocarcinoma; TCGA: The Cancer Genome Atlas; PCA: principal component analysis; t-SNE: t-distributed Stochastic Neighbor Embedding; UMAP: uniform manifold approximation and projection; K-M analysis: Kaplan-Meier analysis; OS: overall survival; ROC: receiver operating characteristic; AUC: area under the curve; HR: hazard ratio. *p < 0.05; **p < 0.01; ***p < 0.001; ****p < 0.0001; ns p > 0.05.

