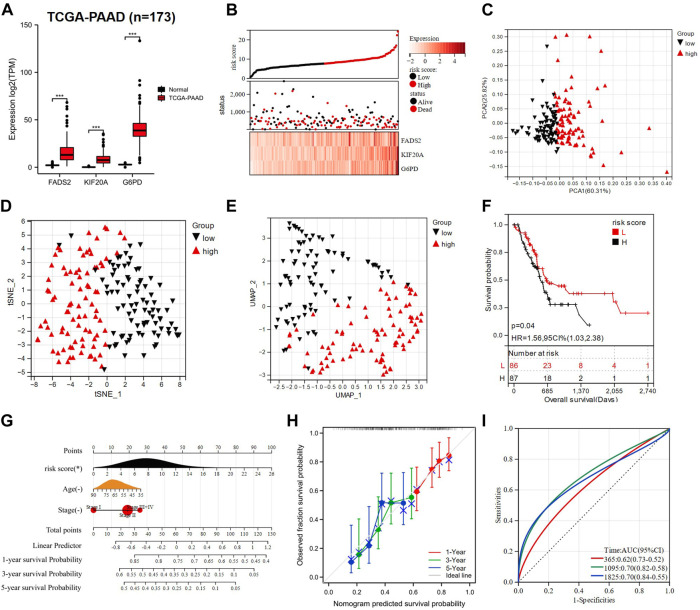
FIGURE 3.
Construction of a PAAD prognostic model based on three candidate genes. (A) Comparison of the expression of three prognostic genes in normal (n = 167) and PAAD tissues (n = 173). (B) TCGA-PAAD patients were divided into two groups based on risk scores. (C–E) PCA, t-SNE, and UMAP analysis of TCGA-PAAD. (F) K-M analysis showed the OS of PAAD patients in the low- and high-risk groups. (G) A nomogram was constructed using risk score, age, and tumor stage. (H) The calibration curves for predicting PAAD patient OS at 1-, 3- and 5- year. (I) ROC analysis of 1-, 3- and 5- year OS in PAAD patients. PAAD: Pancreatic adenocarcinoma; TCGA: The Cancer Genome Atlas; PCA: principal component analysis; t-SNE: t-distributed Stochastic Neighbor Embedding; UMAP: uniform manifold approximation and projection; K-M analysis: Kaplan-Meier analysis; OS: overall survival; CI: combination index; ROC: receiver operating characteristic; AUC: area under the curve; HR: hazard ratio. *p < 0.05; **p < 0.01; ***p < 0.001; ****p < 0.0001; ns p > 0.05.

