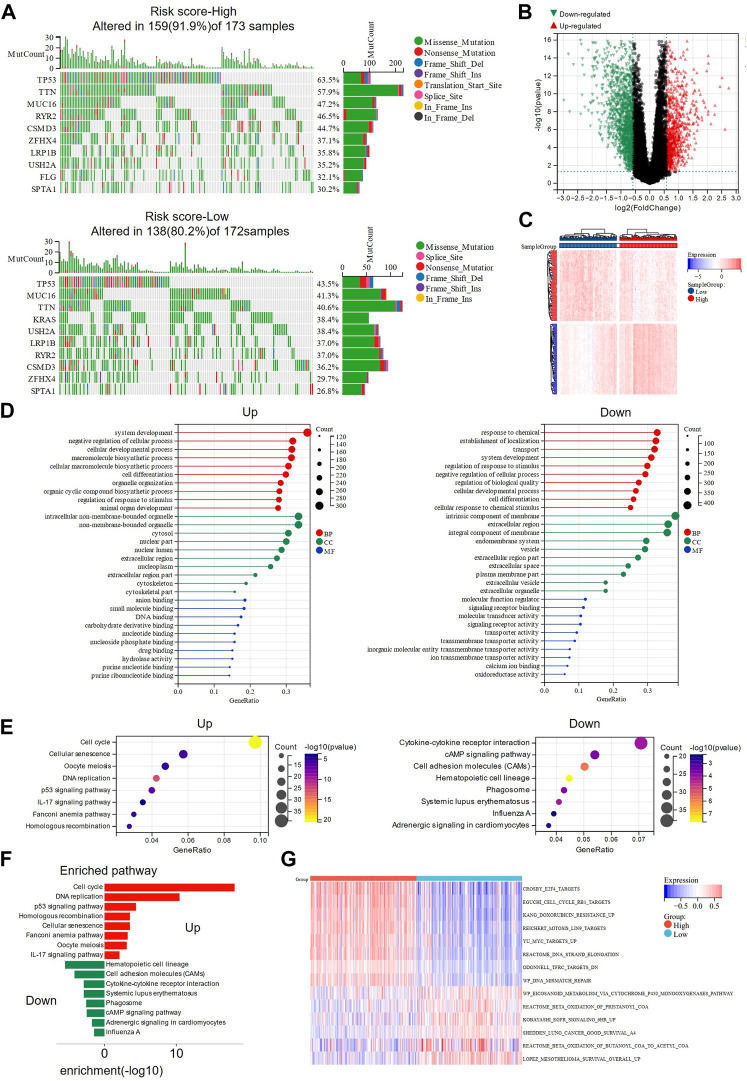
FIGURE 4.
Somatic mutation analysis and functional enrichment analysis of DEGs in high- and low-risk groups. (A) The waterfall plots showed the somatic mutation landscape in high and low risk groups. (B) Volcano plot presenting the DEGs screened between the high- and low-risk groups. (C) The heat map showing the expression of DEGs in high and low-risk groups. (D) GO analysis of up-regulated and down-regulated genes in high-risk group were performed separately. (E,F) KEGG analysis revealed the main pathways involved in DEGs. (G) Pathway activities in high- and low-risk groups were analyzed using GSVA. DEGs: differentially expressed genes; GO: Gene Ontology; KEGG: Genes and Genomes; GSVA: Gene set variation analysis.

