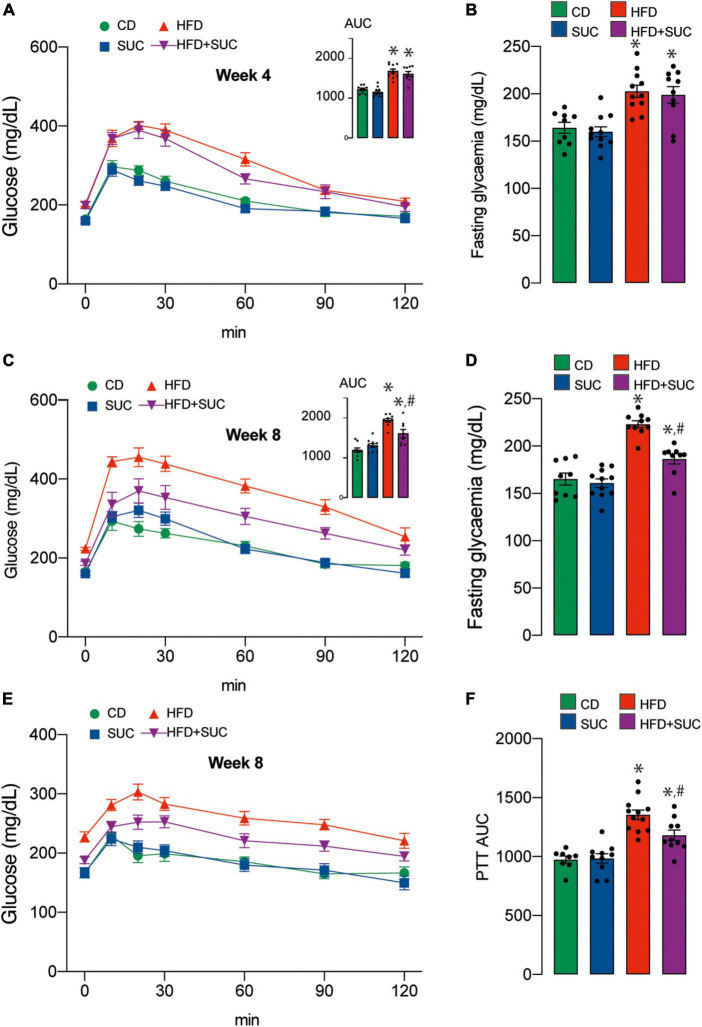
FIGURE 2.
Sucralose improves glucose tolerance in mice fed with a high-fat diet. (A) GTT at 4 weeks. (B) Basal glucose. (C) GTT at 8 weeks. (D) Basal glucose. (E) PTT. (F) PTT AUC. n = 8–12 mice per condition. Two-way analysis of variance (ANOVA) followed by Holm-Sidak’s post-hoc test. Values are expressed as mean ± SEM. *p < 0.05 vs. CD; #p < 0.05 vs. HFD.

