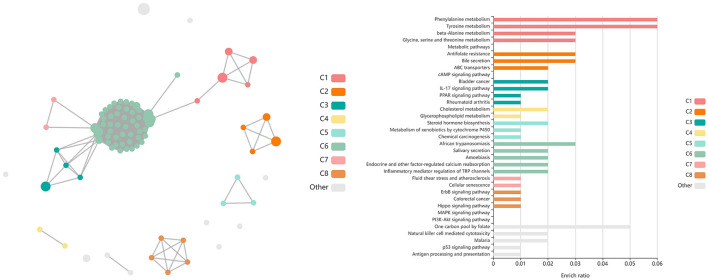
Figure 10.
Clustering of enriched KEGG pathways by term identity from KOBAS-i analysis of DEGs identified from glmmSeq evaluation of the interaction between vaccination and time. Each node represents an enriched term, with color corresponding to the unique cluster based on term identity. Each edge (line between nodes) represents a significant correlation between pathway terms. Bar graphs represent the pathway terms found within each pathway (by color) and the level of enrichment (Enrich ratio). KEGG pathways identified through the interaction of vaccination and time clustered into eight unique clusters. Gray nodes and bar graphed terms represent enriched pathways which did not associate within the clustering model.

