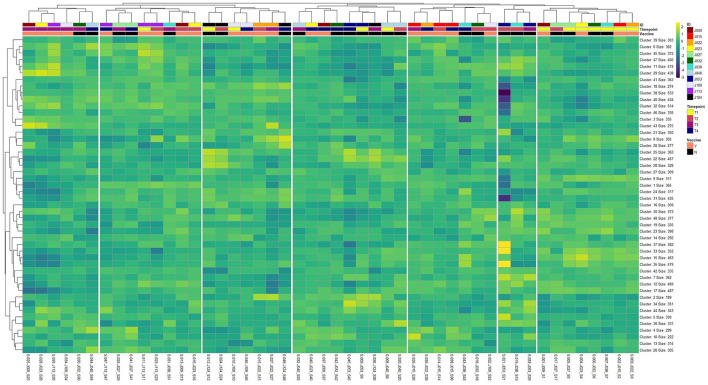
Figure 2.
Heatmap and unsupervised hierarchical clustering analysis of global gene expression patterns across all 48 sample libraries (n = 17,371) following optimal k-means clustering of genes (k = 48). Gene clusters were labeled by clustering order (Cluster) and the total number of genes embedded within each cluster (Size). Sample libraries were labeled top-to-bottom with individual identification (ID), time point for each sample (Timepoint; T1, T2, T3, and T4), and vaccination group (Vaccine; Yes or No).

