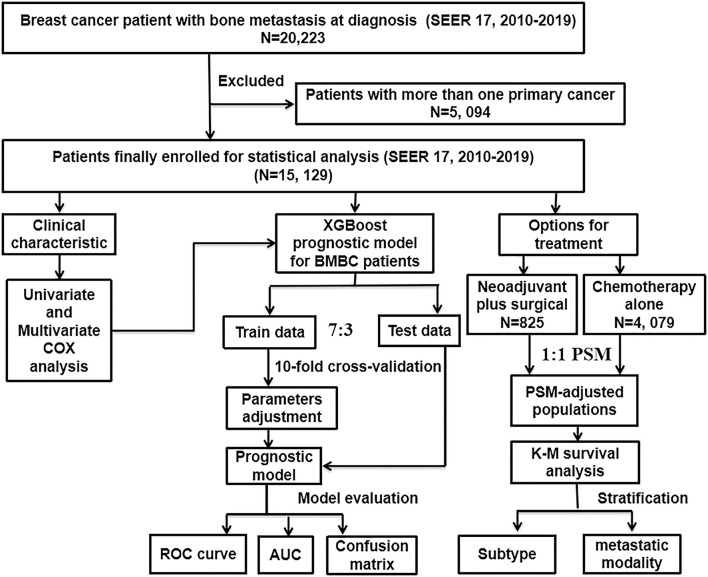
Figure 1.
The flowchart described the process of conducting the study and statistical analysis. SEER, the Surveillance, Epidemiology, and End Results database; BMBC, bone metastatic breast cancer; PSM, propensity score matching; COX, concordance index; ROC curve, receiver operating characteristic curve; AUC, area under the curve; K–M, Kaplan–Meier; XGBoost, extreme gradient boosting.

