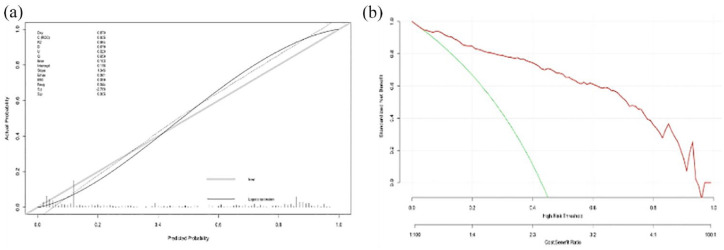
Figure 5.
Calibration curve and decision curve analysis of the support vector machine (SVM) model in Caucasian cohort: (a) Calibration curve of the SVM model and (b) decision curve analysis for the SVM model. The red line indicates the decision curve of the SVM model. The green line stands for the assumption that all patients developed hemorrhagic transformation, and the gray line represents the assumption that no patient had hemorrhagic transformation. The y axis measures the net benefit; the x-axis represents the predictive probability threshold.

