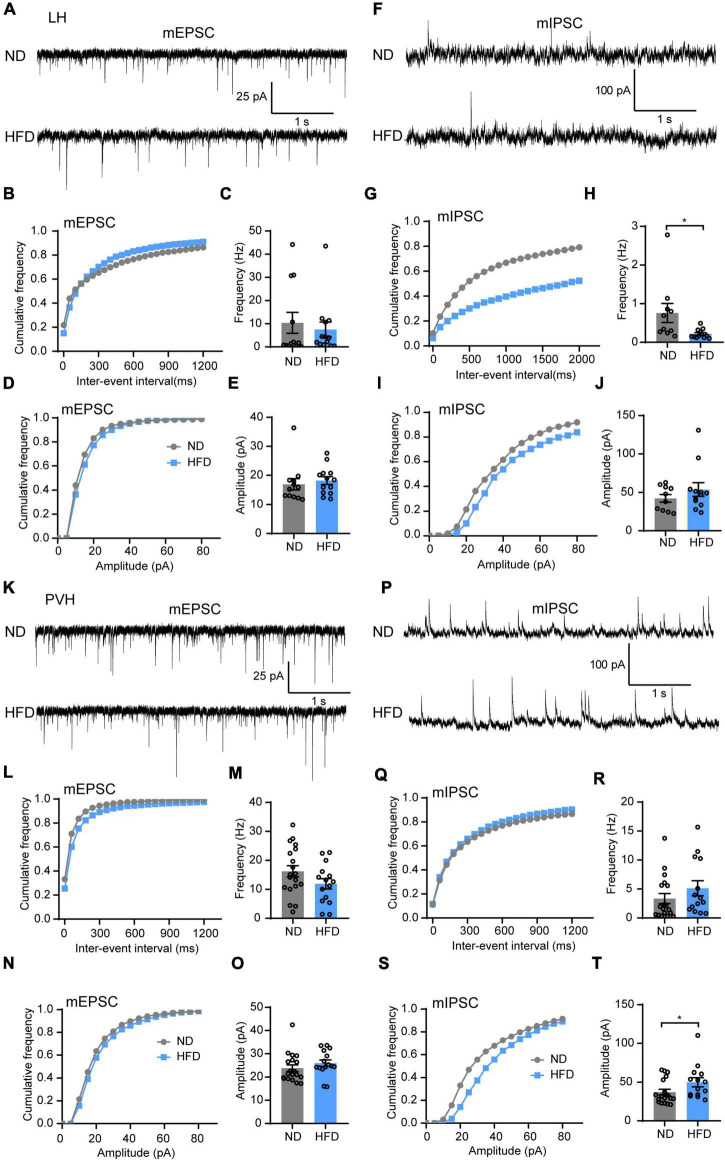
FIGURE 4.
Chronic HFD consumption impairs inhibitory synaptic transmission of the LH and PVH. (A) Representative mEPSC traces recorded from LH neurons for ND and HFD mice. (B,C) Cumulative fraction curves of inter-event intervals (B) and mean frequency (C) of mEPSCs (n = 3–4 mice, 12–13 cells, Mann-Whitney test). (D,E) Cumulative fraction curves of amplitudes (D) and mean amplitude (E) of mEPSCs (n = 3–4 mice, 12–13 cells, Mann-Whitney test). (F) Representative mIPSC traces recorded from LH neurons for ND and HFD mice. (G,H) Cumulative fraction curves of inter-event intervals (G) and mean frequency (H) of mIPSCs (n = 3–4 mice, 10–12 cells, Mann-Whitney test). (I,J) Cumulative fraction curves of amplitudes (I) and mean amplitude (J) of mIPSCs (n = 3–4 mice, 10–12 cells, Mann-Whitney test). (K) Representative mEPSC traces recorded from PVH neurons for ND and HFD mice. (L,M) Cumulative fraction curves of inter-event intervals (L) and mean frequency (M) of mEPSCs (n = 3–4 mice, 15–19 cells, two-tailed unpaired t-test). (N,O) Cumulative fraction curves of amplitudes (N) and mean amplitude (O) of mEPSCs (n = 3–4 mice, 15–19 cells, Mann-Whitney test). (P) Representative mIPSC traces recorded from LH neurons for ND and HFD mice. (Q,R) Cumulative fraction curves of inter-event intervals (Q) and mean frequency (R) of mIPSCs (n = 3–4 mice, 14–18 cells, Mann-Whitney test). (S,T) Cumulative fraction curves of amplitudes (S) and mean amplitude (T) of mIPSCs (n = 3–4 mice, 14–18 cells, Mann-Whitney test). Data are means ± SEMs. Dots represent individual experimental cells. *p < 0.05 as indicated.

