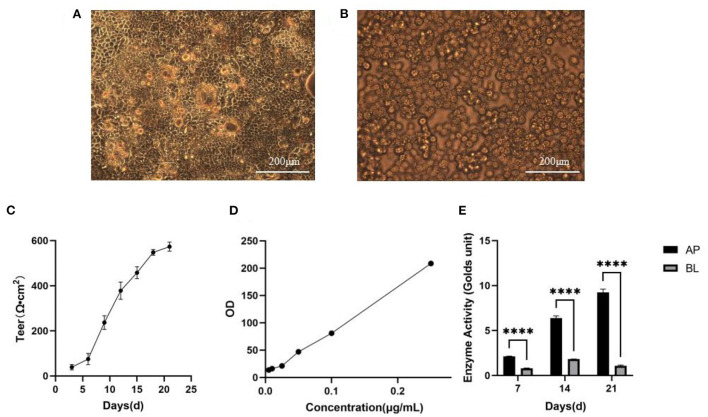
Figure 4.
Establishment of Caco-2 cell model. (A) Morphology of Caco-2 cells observed in 21th day. Scale bar = 200 μm. (B) Morphology of RAW264.7 cells observed in 2th day. Scale bar = 200 μm. (C) TEER of Caco-2 cells with time (n = 3 times per day). (D) The standard curve of lucifer yellow. (E) Alkaline phosphatase activities. ****p < 0.0001 compared with BL side (n = 3 times per group).

