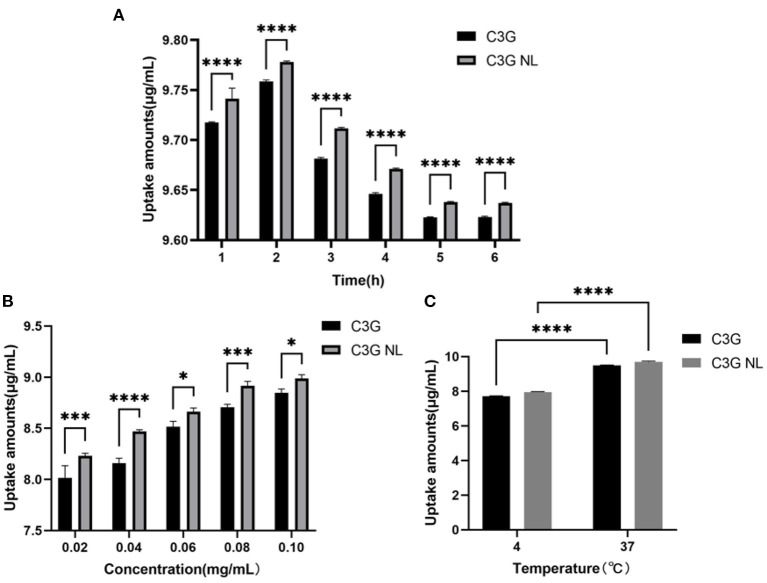
Figure 5.
The uptake of C3G and C3G-NL with different concentrations (0.02–0.10 mg/mL) of cells during 6 h. (A) The effect on the uptake of C3G and C3G-NL (0.2 mg/mL) at different times. ****p < 0.0001 compared with C3G group (n = 3 times per group). (B) The effect of concentration on uptake of C3G and C3G-NL. *, ***, and **** represent P < 0.05, 0.001, and 0.0001, respectively, compared with the C3G group (n = 3 times per group). (C) The effect of temperature on uptake of C3G and C3G-NL. ****p < 0.0001 compared with 4°C group (n = 3 times per group).

