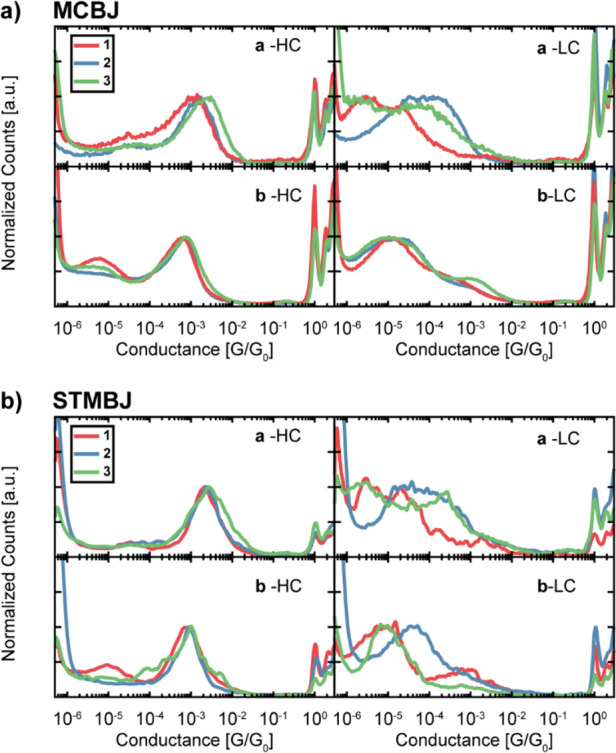
Figure 3.

Measured conductance. 1D-conductance histograms for (a) MCBJ and (b) STMBJ measurements of the HC (left) and LC (right) peaks as obtained from clustering, separated by anchoring group (top: −SAc, bottom: −SMe; see Supporting Information for more information). The measurements have been normalized by the peak height to make the peak position and shape directly comparable across the different molecules.
