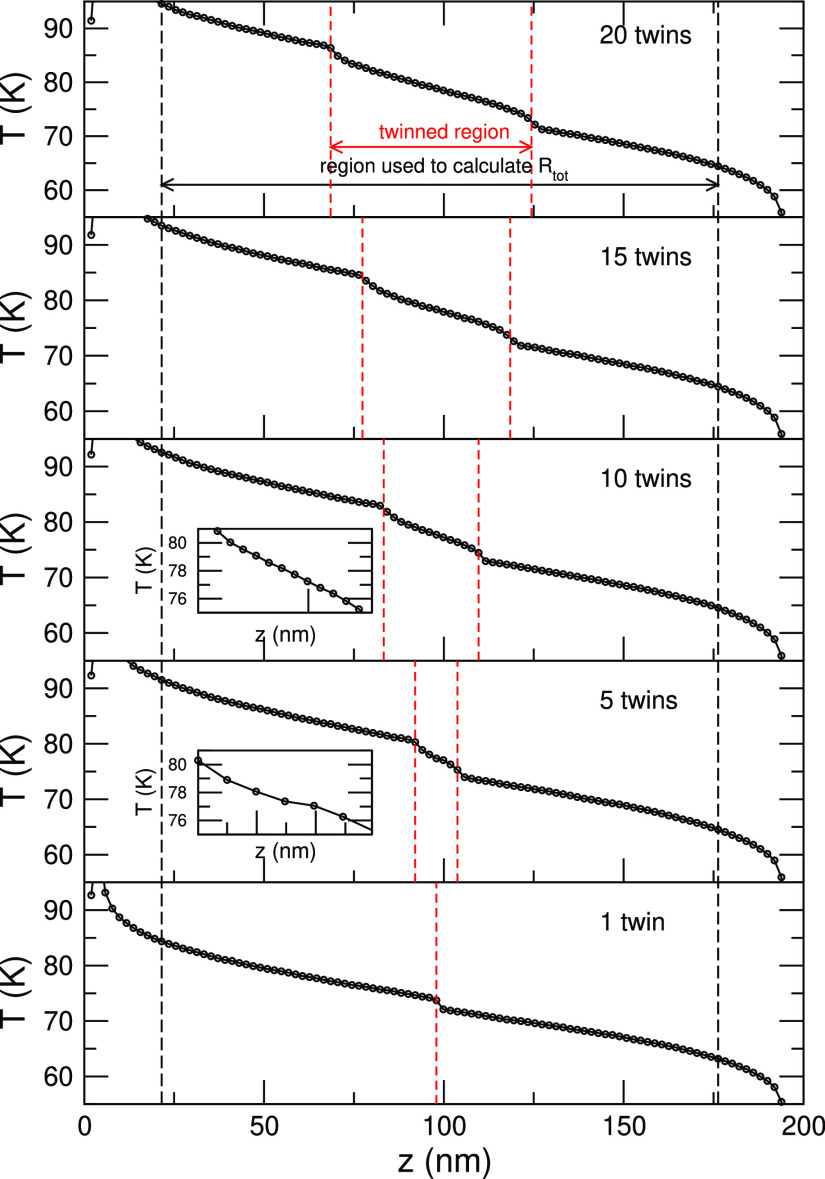
Figure 5.
Temperature profile, T(z), for a GaAs system with N = 1, 5, 10, 15, and 20 twins with a constant intertwin separation, δ, and with TM = 100 K. The red dashed lines indicate the position of the first and last twin boundaries (i.e., the thickness of the twinned region). The coordinates, zi and zf, used to evaluate ΔT to yield ΔR in Figure 3 are marked by the red dashed lines. Inset displays a zoomed view of T(z) of the twinned region.

