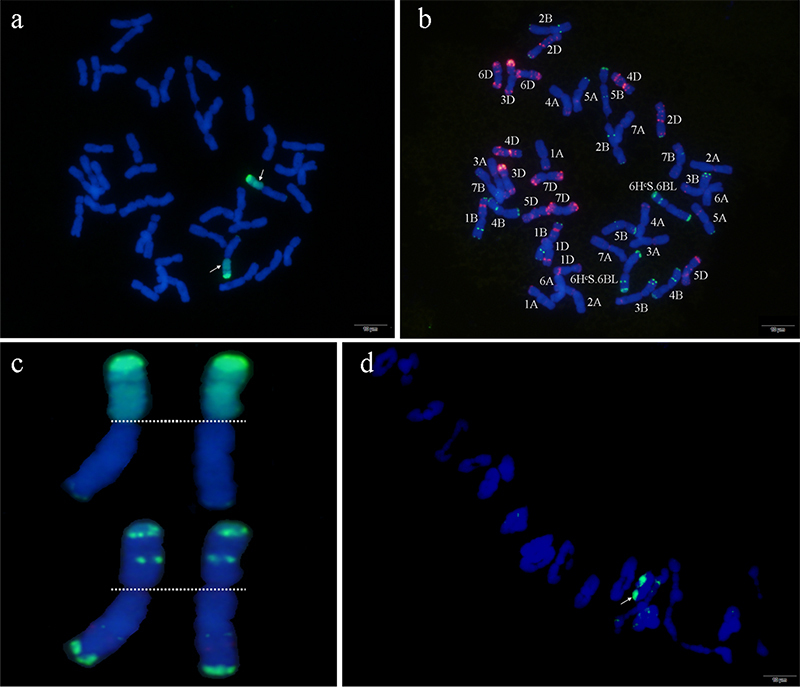
Figure 2 -. Sequential GISH/FISH analysis of the wheat- H.californicum translocation line ND646. a. GISH of ND646, the genome DNA of H.californicum was visualized in bright green; b. FISH of ND646 using pSc119.2 (shown in red) and pAs1 (shown in green) repetitive DNA as probes, white arrows show the translocation chromosome; c. GISH and FISH diagram of translocation chromosomes in DN646, respectively; d. There were 21 bivalents containing one translocation bivalent (shown in green) at the metaphase I (MI) stage in pollen mother cells (PMCs) of ND646 (Scale bar = 20µm).

