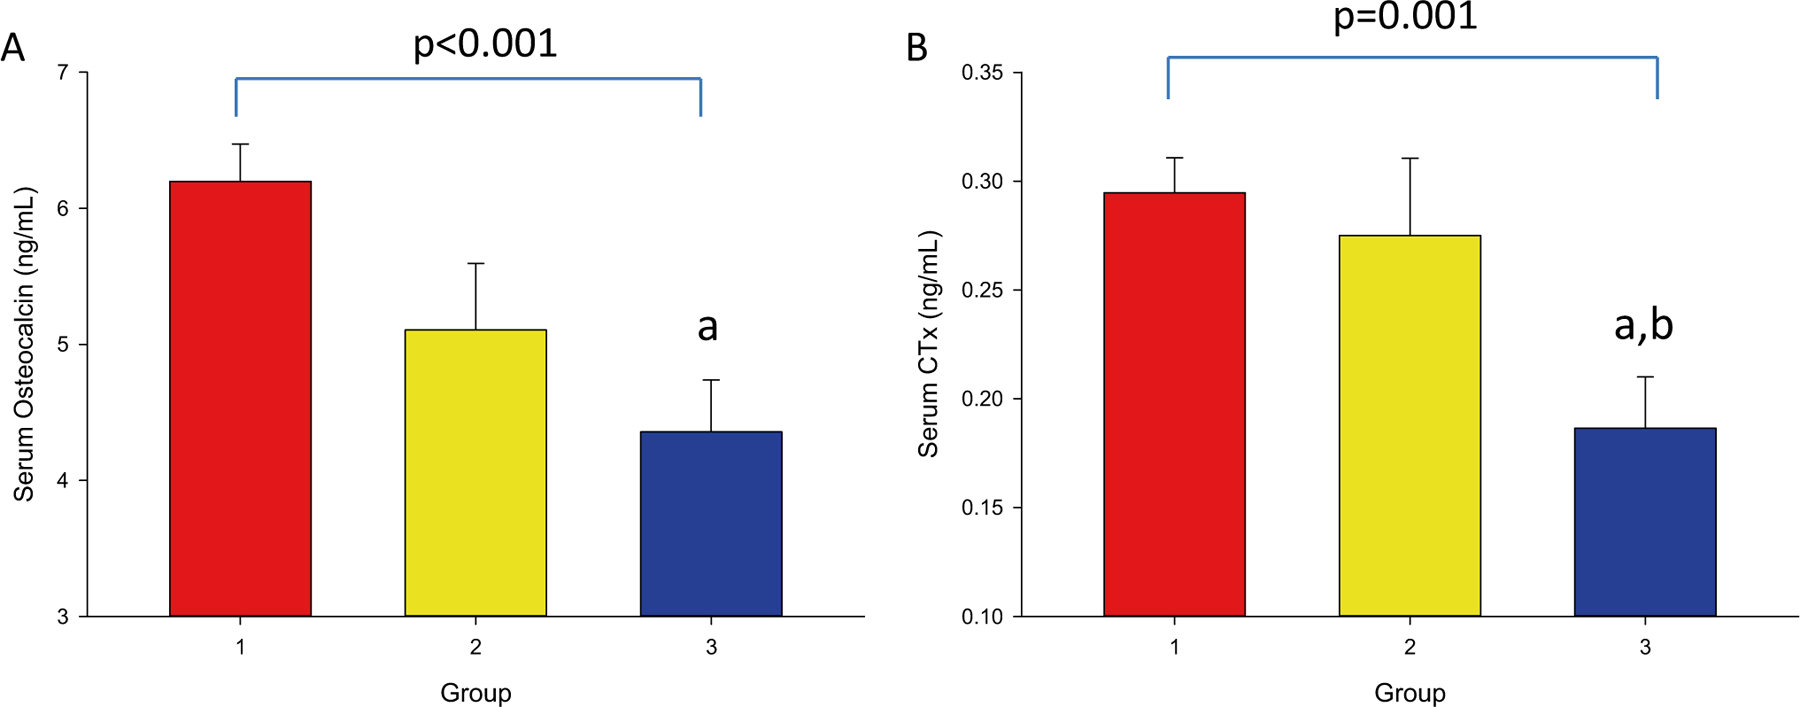
Fig. 2.

Serum osteocalcin (OCN) and C-terminal telopeptide (CTx) Concentrations at − 12 Month. 2A: OCN by A1C group. 2B: CTx by A1C group. − 12 Month: 12 months prior to study enrollment. Groups were defined as: 1) no T2DM, 2) T2DM with A1C ≤ 7%, and 3) T2DM with A1C > 7%. Superscripts refer to post-hoc analyses, indicating that the value is: a) p < 0.05 compared to group 1, and b) p < 0.05 compared to group 2
